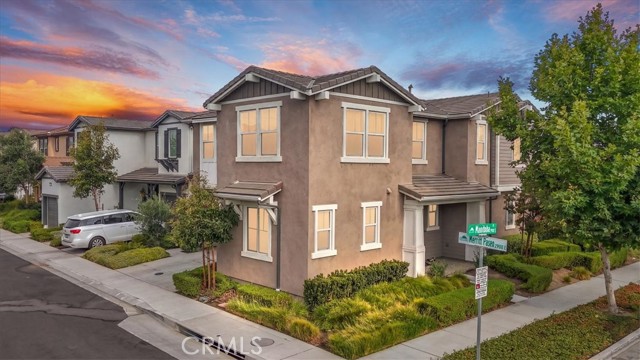
2904 East Merritt Paseo, Ontario, CA 91761
2904 East Merritt Paseo, Ontario, CA 91761
Property Description
Experience elevated living in this beautiful former model home in Ontario Ranch, showcasing thoughtful upgrades and refined finishes throughout. The inviting main level features seamless tile flooring, a private bedroom and full bath, and a beautifully upgraded kitchen with granite countertops, enhanced cabinetry, a spacious pantry, and breakfast counter seating. Upstairs, the spacious primary bedroom features two walk-in closets and a large upgraded shower. The upstairs laundry room offers generous cabinet storage, while custom garage cabinetry provides even more space for organization. A sophisticated, move-in-ready home designed for modern living, comfort, and style.
Features & Amenities
Property Details
Mortgage Calculator
Current Rates
Comparative Market Analysis
Residential Tier · 5 active · 5 closed
Ontario · Single Family Residence
Listed 14.2% above the median closed sale of $848,000. Price per sqft ($409) is a 29% premium to closed comps ($316). Closed comps sold at 100% of list — strong seller's market.
Price Position
Positioned above the market — commands a premium.
Active Properties (5)
Active Comparables
| Address | City | Year | BD | BTH | SqFt | LotSz | LP/SqFt | LP | DIM | Score |
|---|---|---|---|---|---|---|---|---|---|---|
| 3267 Sprout Paseo | Ontario | 2025 | 5 | 3 | 2,376 | 3,224 | $353 | $838,712 | 6 | 89 |
| 2659 Dolomite Avenue | Ontario | 2025 | 4 | 3 | 2,380 | 4,756 | $350 | $833,000 | 52 | 88 |
| 3931 Mondavi Way | Ontario | 2019 | 4 | 3 | 2,792 | 4,050 | $307 | $858,000 | 74 | 86 |
| 3114 Yellowstone Drive | Ontario | 2019 | 5 | 3 | 2,765 | 4,599 | $302 | $835,000 | 69 | 83 |
| 4722 Cobblestone | Ontario | 2021 | 4 | 3 | 2,934 | 4,249 | $305 | $895,000 | 124 | 81 |
| Total: 5 · Average | 4.4 | 3.0 | 2,649.4 | 4,175.6 | $323.4 | $851,942.4 | 65 | |||
| Median | 2,765 | $838,712 | ||||||||
Closed Properties (5)
Closed Comparables
| Address | City | Year | Date | BD | BTH | SqFt | LotSz | LP | SP | SP/SqFt | SP/LP | DIM | Score |
|---|---|---|---|---|---|---|---|---|---|---|---|---|---|
| 4050 Bowery pl | Ontario | 2022 | 10/05/2026 | 4 | 3 | 2,532 | 5,440 | $799,999 | $833,000 | $329 | 1.04 | 50 | 89 |
| 4043 Inglenook | Ontario | 2018 | 08/27/2026 | 4 | 3 | 3,105 | 4,050 | $850,000 | $848,000 | $273 | 1.00 | 193 | 86 |
| 3210 Rutherford Drive | Ontario | 2020 | 12/02/2025 | 4 | 3 | 2,792 | 4,050 | $928,000 | $910,000 | $326 | 0.98 | 151 | 85 |
| 3010 Bourbon Street | Ontario | 2021 | 05/22/2026 | 4 | 3 | 2,532 | 6,000 | $835,000 | $830,000 | $328 | 0.99 | 50 | 84 |
| 3743 Green Avenue | Ontario | 2015 | 06/12/2026 | 4 | 3 | 2,626 | 5,250 | $850,000 | $850,000 | $324 | 1.00 | 58 | 84 |
| Total: 5 · Average | 4.0 | 3.0 | 2,717.4 | 4,958 | $854,200 | $854,200 | $316 | — | 100.4 | ||||
| Median | 2,626 | $848,000 | $848,000 | ||||||||||
Market Analysis
List vs Sale $/SqFt
Sale Price Trend
Days on Market
Sale vs List Price
This analysis was generated automatically from MLS data. For an in-depth, human-reviewed valuation, contact Joseph Sardella at josephsardella@gmail.com.