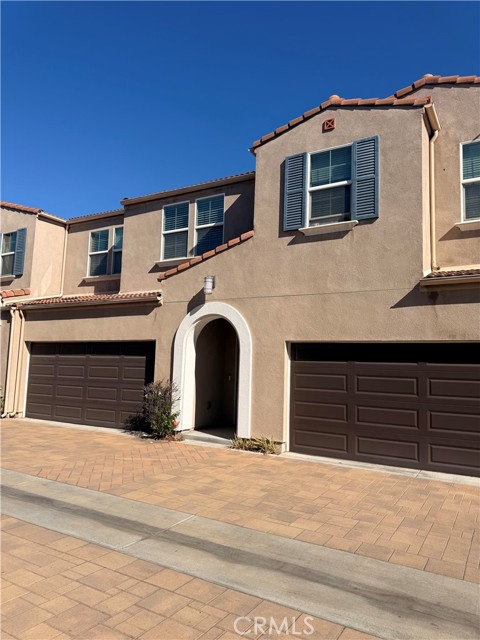
1 / 9
287 East Arrow, 22, Glendora, CA 91740
$650K3bd · 3ba · 1,700 sqft
Lot 39,124 sqft•HOA $235/mo•Condominium•Active•53d on market•MLS# CV-26197966
287 East Arrow, 22, Glendora, CA 91740
MLS# CV-26197966•Residential•Condominium
Active53 days on market
$650,000
3
Beds
3
Baths
1,700
Sq Ft
39,124
Lot Sq Ft
$235
HOA/mo
2016
Year Built
None
View
Property Description
Nice, clean condo, built in 2016, move in ready. Nice flooring, main bedroom has 2 walk in closets, solar panels are paid. A MUST SEE. 'Some photos have been virtually staged'
Features & Amenities
FeeBuilt 2016
Property Details
Land Type
Fee
Year Built
2016
Property Type
Residential
Property Subtype
Condominium
Parking Spaces
2
Garage Spaces
2
Heating
Central
Cooling
Central Air, See Remarks
View
None
City
Glendora
Zip Code
91740
County
Los Angeles
Mortgage Calculator
Current Rates
$
$
%
Monthly Payment
$3,286.75
Principal & Interest
Loan Amount
$520,000
Total Interest
$663,231
Total Payment Over 30 Years
$1,183,231
This calculator provides estimates only. Actual mortgage payments may include taxes, insurance, HOA fees, and PMI. Contact a lender for accurate quotes.
Comparative Market Analysis
Residential Tier · 5 active · 5 closed
287 East Arrow, 22, Glendora, CA 91740
Glendora · Condominium
$650K
Residential TierBeds
3
Baths
3
Sqft
1,700
Lot
39,124 sqft
Year
2016
$/Sqft
$382
Pool: No✓
View: None✓
Garage: 2-car✓
Listed 4.0% above the median closed sale of $625,000. Price per sqft ($382) is a 17% discount to closed comps ($463). Closed comps sold at 102% of list — strong seller's market.
Price Position
Aligned with the market — fair pricing for the comps.
At market
Subject listed at $650K· $382/sqft
Total list price
Closed comps
vs closed median $625K
+$25K (+4.0%)
Active comps
vs active median $650K
$0 (0.0%)
Price per sqft
Closed compsinsufficient comp data
Active comps
vs active avg $/sqft $457
−$75 (−16.3%)
Active Properties (5)
Active Comparables
| Address | City | Year | BD | BTH | SqFt | LotSz | LP/SqFt | LP | DIM | Score |
|---|---|---|---|---|---|---|---|---|---|---|
| 441 Glendora Avenue | Glendora | 2014 | 3 | 3 | 1,380 | 50,278 | $496 | $685,000 | 116 | 77 |
| 422 Route 66 | Glendora | 2017 | 4 | 4 | 1,860 | 13,490 | $392 | $729,000 | 16 | 73 |
| 161 Dove | Covina | 2024 | 3 | 3 | 1,542 | 6,985 | $414 | $638,000 | 3 | 73 |
| 163 Dove Landing | Covina | 2024 | 2 | 3 | 1,248 | 0 | $517 | $645,000 | 158 | 70 |
| 1179 Sunflower Avenue | Covina | 1980 | 3 | 3 | 1,402 | 72,227 | $464 | $650,000 | 75 | 68 |
| Total: 5 · Average | 3.0 | 3.2 | 1,486.4 | 35,745 | $456.6 | $669,400 | 73.6 | |||
| Median | 1,402 | $650,000 | ||||||||
Closed Properties (5)
Closed Comparables
| Address | City | Year | Date | BD | BTH | SqFt | LotSz | LP | SP | SP/SqFt | SP/LP | DIM | Score |
|---|---|---|---|---|---|---|---|---|---|---|---|---|---|
| 1210 Sunflower | Covina | 1992 | 08/11/2026 | 3 | 3 | 1,342 | 34,847 | $615,000 | $625,000 | $466 | 1.02 | 85 | 81 |
| 745 Claraday | Glendora | 1979 | 06/26/2026 | 3 | 3 | 1,263 | 49,599 | $575,000 | $580,000 | $459 | 1.01 | 57 | 80 |
| 1189 Sunflower | Covina | 1980 | 10/02/2026 | 3 | 3 | 1,402 | 72,227 | $650,000 | $640,000 | $456 | 0.98 | 53 | 75 |
| 1164 Lyman | Covina | 1979 | 10/29/2026 | 4 | 3 | 1,331 | 90,161 | $599,999 | $645,000 | $485 | 1.07 | 50 | 71 |
| 1137 Lyman Avenue | Covina | 1978 | 11/18/2025 | 4 | 3 | 1,331 | 76,561 | $598,800 | $600,000 | $451 | 1.00 | 60 | 67 |
| Total: 5 · Average | 3.4 | 3.0 | 1,333.8 | 64,679 | $618,000 | $618,000 | $463.4 | — | 61 | ||||
| Median | 1,331 | $625,000 | $625,000 | ||||||||||
Market Analysis
List vs Sale $/SqFt
Sale Price Trend
Days on Market
Sale vs List Price
AI-generated CMA
This analysis was generated automatically from MLS data. For an in-depth, human-reviewed valuation, contact Joseph Sardella at josephsardella@gmail.com.