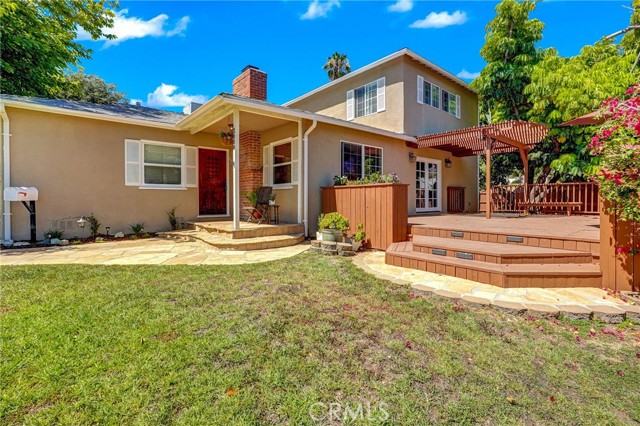
2800 Jolley Drive, Burbank, CA 91504
2800 Jolley Drive, Burbank, CA 91504
Property Description
NEW PRICE REDUCTION MOTIVATED SELLER. BACK ON THE MARKET, BUYERS FAILED TO PERFORM. NO FAULT OF THE PROPERTY. First time on the market for almost 30 years, this 4 bedroom 3 bath stunner with a bonus office that can be used for a 5th bedroom, will not dissapoint. Tucked away in the Burbank hills, within walking distance to Brace Canyon Park and a few minutes away from DeBell Golf Club, Starlight Bowl and a short drive to Downtown Burbank with the vast array of restaurants and shops. The house features a beautiful deck to enjoy alfresco dining while enjoying a serene sunset surrounded with a manicured lawn. The house has been lovingly well cared for with recent updates to the electrical panel, floors, water heater, windows and a new roof. Don't sleep on this opportunity, it will not last.
Features & Amenities
Property Details
Mortgage Calculator
Current Rates
Comparative Market Analysis
Luxury Tier · 5 active · 5 closed
Burbank · Single Family Residence
Listed 4.5% below the median closed sale of $1,675,000. Closed comps sold at 101% of list — strong seller's market. Luxury tier — fewer comparable sales widen the confidence range.
Price Position
Aligned with the market — fair pricing for the comps.
Active Properties (5)
Active Comparables
| Address | City | Year | BD | BTH | SqFt | LotSz | LP/SqFt | LP | DIM | Score |
|---|---|---|---|---|---|---|---|---|---|---|
| 1404 Naomi Street | Burbank | 1941 | 4 | 3 | 2,141 | 6,021 | $682 | $1.46M | 38 | 78 |
| 642 Birmingham Road | Burbank | 1951 | 3 | 2 | 1,812 | 6,820 | $773 | $1.40M | 8 | 73 |
| 537 Stanford Road | Burbank | 1944 | 7 | 4 | 2,981 | 11,034 | $602 | $1.79M | 40 | 72 |
| 636 Andover | Burbank | 1951 | 3 | 2 | 1,604 | 7,017 | $885 | $1.42M | 23 | 71 |
| 1245 Orchard Drive | Burbank | 1928 | 2 | 2 | 963 | 6,752 | $1,506 | $1.45M | 30 | 68 |
| Total: 5 · Average | 3.8 | 2.6 | 1,900.2 | 7,528.8 | $889.6 | $1.50M | 27.8 | |||
| Median | 1,812 | $1.45M | ||||||||
Closed Properties (5)
Closed Comparables
| Address | City | Year | Date | BD | BTH | SqFt | LotSz | LP | SP | SP/SqFt | SP/LP | DIM | Score |
|---|---|---|---|---|---|---|---|---|---|---|---|---|---|
| 2213 Jolley | Burbank | 1951 | 09/22/2026 | 4 | 3 | 1,892 | 6,098 | $1.63M | $1.68M | $885 | 1.03 | 21 | 91 |
| 2724 Kenneth | Burbank | 1953 | 06/30/2026 | 4 | 3 | 2,088 | 10,536 | $1.80M | $1.60M | $766 | 0.89 | 39 | 90 |
| 435 Eton Drive | Burbank | 1950 | 05/29/2026 | 4 | 2 | 2,290 | 8,216 | $1.75M | $1.76M | $771 | 1.01 | 44 | 88 |
| 644 Hampton Road | Burbank | 1952 | 05/22/2026 | 3 | 2 | 1,923 | 5,999 | $1.41M | $1.50M | $780 | 1.06 | 30 | 88 |
| 736 Brown | Burbank | 1952 | 06/03/2026 | 4 | 3 | 2,160 | 6,781 | $1.65M | $1.72M | $798 | 1.04 | 41 | 81 |
| Total: 5 · Average | 3.8 | 2.6 | 2,070.6 | 7,526 | $1.65M | $1.65M | $800 | — | 35 | ||||
| Median | 2,088 | $1.68M | $1.68M | ||||||||||
Market Analysis
List vs Sale $/SqFt
Sale Price Trend
Days on Market
Sale vs List Price
This analysis was generated automatically from MLS data. For an in-depth, human-reviewed valuation, contact Joseph Sardella at josephsardella@gmail.com.