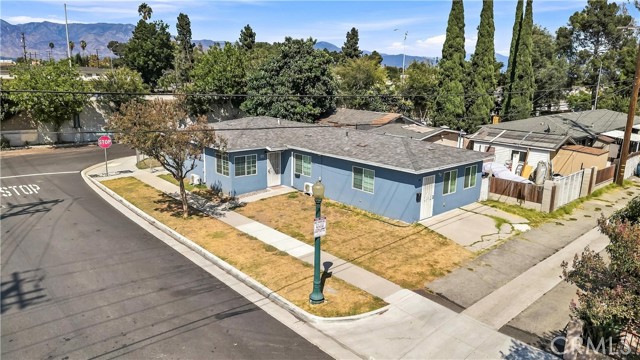
28 West Ramona Road, Alhambra, CA 91803
28 West Ramona Road, Alhambra, CA 91803
Property Description
Exceptional live-in investment opportunity in top-rated Alhambra Unified School District! This well-maintained income property offers a total of 2 units in a highly desirable location with convenient access to the 10 Freeways and unbeatable central location with supermarkets and incredible variety of top-rated local restaurants. 28 W Ramona Rd –3-bedroom, 2-bath with new roof and new exterior painting done in 2025. 30 W Ramona Rd – Beautifully new permitted build ADU with kitchen and bathroom in 2023. The property is 100% tenant occupied and generates strong, stable rental income.
Features & Amenities
Property Details
Mortgage Calculator
Current Rates
Comparative Market Analysis
Residential Tier · 5 active · 5 closed
Alhambra · Single Family Residence
Listed in line with the median closed sale of $930,000.
Price Position
Aligned with the market — fair pricing for the comps.
Active Properties (5)
Active Comparables
| Address | City | Year | BD | BTH | SqFt | LotSz | LP/SqFt | LP | DIM | Score |
|---|---|---|---|---|---|---|---|---|---|---|
| 2412 Hagen | Alhambra | 1948 | 3 | 2 | 1,137 | 5,615 | $781 | $888,000 | 11 | 72 |
| 195 Nicholson Avenue | Monterey Park | 1989 | 3 | 3 | 1,626 | 33,952 | $547 | $889,000 | 290 | 71 |
| 1421 Norwood Pl | Alhambra | 1947 | 3 | 2 | 1,737 | 6,465 | $576 | $999,999 | 44 | 70 |
| 4692 Solstice Avenue | Ontario | 2026 | 4 | 3 | 2,755 | 4,270 | $351 | $965,990 | 171 | 70 |
| 1833 Chapel | Alhambra | 1931 | 3 | 2 | 1,024 | 6,700 | $957 | $980,000 | 38 | 69 |
| Total: 5 · Average | 3.2 | 2.4 | 1,655.8 | 11,400.4 | $642.4 | $944,597.8 | 110.8 | |||
| Median | 1,626 | $965,990 | ||||||||
Closed Properties (5)
Closed Comparables
| Address | City | Year | Date | BD | BTH | SqFt | LotSz | LP | SP | SP/SqFt | SP/LP | DIM | Score |
|---|---|---|---|---|---|---|---|---|---|---|---|---|---|
| 1203 Pontenova | Hacienda Heights | 1955 | 07/15/2026 | 3 | 2 | 1,290 | 6,376 | $858,000 | $842,000 | $653 | 0.98 | 70 | 77 |
| 315 Norwood | Alhambra | 1926 | 05/06/2026 | 4 | 3 | 2,209 | 4,124 | $1.07M | $930,000 | $421 | 0.86 | 104 | 76 |
| 521 South Alhambra Avenue | Monterey Park | 1951 | 05/18/2026 | 3 | 3 | 1,384 | 9,266 | $990,000 | $950,000 | $686 | 0.96 | 88 | 75 |
| 1809 5th Street | Alhambra | 1913 | 05/18/2026 | 3 | 2 | 1,466 | 7,624 | $988,000 | $1.02M | $696 | 1.03 | 31 | 72 |
| 1609 Sierra Vista | Alhambra | 1936 | 05/06/2026 | 2 | 2 | 1,234 | 7,722 | $999,900 | $920,000 | $746 | 0.92 | 32 | 66 |
| Total: 5 · Average | 3.0 | 2.4 | 1,516.6 | 7,022.4 | $932,400 | $932,400 | $640.4 | — | 65 | ||||
| Median | 1,384 | $930,000 | $930,000 | ||||||||||
Market Analysis
List vs Sale $/SqFt
Sale Price Trend
Days on Market
Sale vs List Price
This analysis was generated automatically from MLS data. For an in-depth, human-reviewed valuation, contact Joseph Sardella at josephsardella@gmail.com.