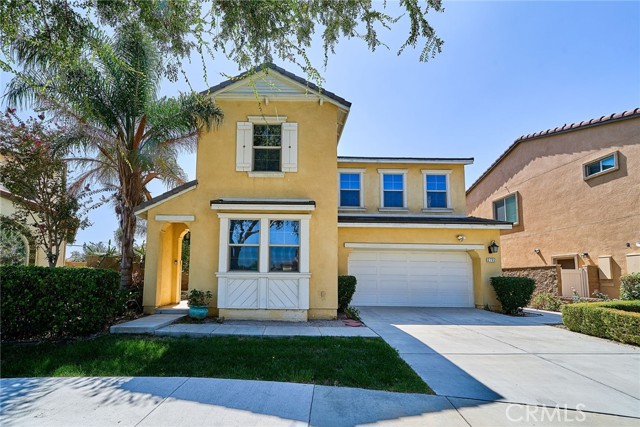
2782 East Thompson, Ontario, CA 91762
2782 East Thompson, Ontario, CA 91762
Property Description
Beautifully maintained 4 bedroom, 3 bathroom home offering 2504 sq.ft living space. Fully Paid off solar panels and a Tesla Charger installed in the garage provides added convenience and potential energy savings! The thoughtful designed layout offers excellent flow and functionality, with a bright and open floor plan featuring a spacious kitchen with a large center island and abundant natural light. One bedroom and a full bathroom downstairs, ideal for guests or extended family. Enjoy a private front yard, spacious backyard, and community amenities including a pool and gym. Conveniently located near shopping, dining, parks, schools, and major freeways. Move-in ready!
Features & Amenities
Property Details
Mortgage Calculator
Current Rates
Comparative Market Analysis
Residential Tier · 5 active · 5 closed
Ontario · Single Family Residence
Listed 5.7% below the median closed sale of $840,000.
Price Position
Priced below the market — value advantage over the field.
Active Properties (5)
Active Comparables
| Address | City | Year | BD | BTH | SqFt | LotSz | LP/SqFt | LP | DIM | Score |
|---|---|---|---|---|---|---|---|---|---|---|
| 4847 Rosemary | Ontario | 2018 | 4 | 3 | 2,718 | 4,710 | $313 | $850,000 | 37 | 96 |
| 5092 Heritage Paseo | Ontario | 2016 | 4 | 3 | 2,336 | 3,881 | $329 | $768,800 | 2 | 95 |
| 4723 Rogers | Ontario | 2019 | 4 | 3 | 2,403 | 4,500 | $314 | $755,000 | 39 | 95 |
| 5087 Centennial | Ontario | 2015 | 4 | 3 | 2,414 | 3,954 | $339 | $818,500 | 27 | 94 |
| 5111 Victory Lane | Ontario | 2017 | 4 | 4 | 2,507 | 5,279 | $331 | $830,000 | 54 | 93 |
| Total: 5 · Average | 4.0 | 3.2 | 2,475.6 | 4,464.8 | $325.2 | $804,460 | 31.8 | |||
| Median | 2,414 | $818,500 | ||||||||
Closed Properties (5)
Closed Comparables
| Address | City | Year | Date | BD | BTH | SqFt | LotSz | LP | SP | SP/SqFt | SP/LP | DIM | Score |
|---|---|---|---|---|---|---|---|---|---|---|---|---|---|
| 4904 S Rosemary Way | Ontario | 2017 | 09/09/2026 | 4 | 3 | 2,414 | 5,479 | $828,000 | $830,000 | $344 | 1.00 | 47 | 96 |
| 4883 Bountiful | Ontario | 2018 | 10/05/2026 | 4 | 3 | 2,718 | 4,325 | $868,000 | $853,000 | $314 | 0.98 | 40 | 95 |
| 5155 S Oxford Ln | Ontario | 2016 | 09/25/2026 | 4 | 3 | 2,718 | 4,441 | $879,000 | $860,000 | $316 | 0.98 | 70 | 95 |
| 5082 Heritage Paseo | Ontario | 2016 | 06/10/2026 | 4 | 3 | 2,479 | 3,882 | $766,000 | $755,000 | $305 | 0.99 | 60 | 94 |
| 2635 Harper | Ontario | 2020 | 08/13/2026 | 4 | 3 | 2,339 | 4,237 | $868,000 | $840,000 | $359 | 0.97 | 61 | 93 |
| Total: 5 · Average | 4.0 | 3.0 | 2,533.6 | 4,472.8 | $827,600 | $827,600 | $327.6 | — | 55.6 | ||||
| Median | 2,479 | $840,000 | $840,000 | ||||||||||
Market Analysis
List vs Sale $/SqFt
Sale Price Trend
Days on Market
Sale vs List Price
This analysis was generated automatically from MLS data. For an in-depth, human-reviewed valuation, contact Joseph Sardella at josephsardella@gmail.com.