1 / 30
2759 North Chauncey, Orange, CA 92867
$2.9M6bd · 5ba · 6,000 sqft
Lot 14,000 sqft•HOA $410/mo•Single Family Residence•Active•207d on market•MLS# PW-26077482
2759 North Chauncey, Orange, CA 92867
MLS# PW-26077482•Residential•Single Family Residence
Active207 days on market
$2,900,000
6
Beds
5
Baths
6,000
Sq Ft
14,000
Lot Sq Ft
$410
HOA/mo
1990
Year Built
City Lights, Hills
View
Property Description
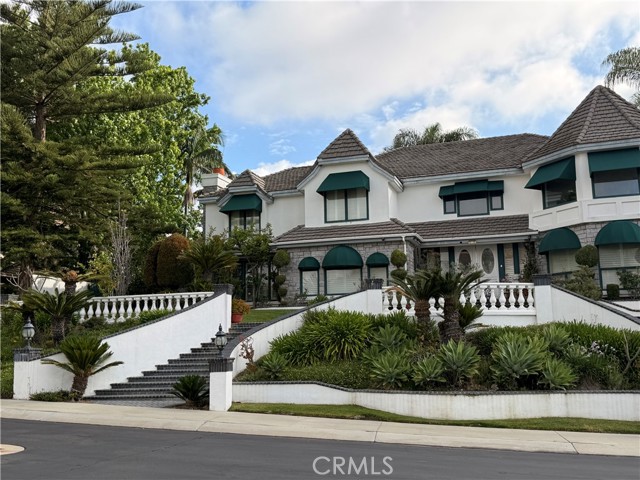
Gorgeous custom guard gated Hillcrest Estate! Corner lot with impressive views from the front. Amazing curb appeal and many custom features! This impressive French Provincial home has stunning marble flooring and cathedral ceilings.
Features & Amenities
FeeBuilt 1990
Property Details
Land Type
Fee
Year Built
1990
Property Type
Residential
Property Subtype
Single Family Residence
Parking Spaces
3
Garage Spaces
3
Heating
Central, Fireplace(s), Forced Air
Cooling
Central Air, Dual
View
City Lights, Hills
Flooring
Carpet, Tile, Wood
City
Orange
Zip Code
92867
County
Orange
Mortgage Calculator
Current Rates
$
$
%
Monthly Payment
$14,663.98
Principal & Interest
Loan Amount
$2,320,000
Total Interest
$2,959,032
Total Payment Over 30 Years
$5,279,032
This calculator provides estimates only. Actual mortgage payments may include taxes, insurance, HOA fees, and PMI. Contact a lender for accurate quotes.
Comparative Market Analysis
Luxury Tier · 5 active · 5 closed
2759 North Chauncey, Orange, CA 92867
Orange · Single Family Residence
$2.9M
Luxury TierBeds
6
Baths
5
Sqft
6,000
Lot
14,000 sqft
Year
1990
$/Sqft
$483
Pool: Yes✓
Spa: Yes✓
View: city✓
Garage: 3-car✓
Listed 7.0% above the median closed sale of $2,710,000. Price per sqft ($483) is a 26% discount to closed comps ($656). Luxury tier — fewer comparable sales widen the confidence range.
Price Position
Positioned above the market — commands a premium.
Premium
Subject listed at $2.90M· $483/sqft
Total list price
Closed comps
vs closed median $2.71M
+$190K (+7.0%)
Active comps
vs active median $2.79M
+$105K (+3.8%)
Price per sqft
Closed compsinsufficient comp data
Active comps
vs active avg $/sqft $633
−$150 (−23.7%)
Active Properties (5)
Active Comparables
| Address | City | Year | BD | BTH | SqFt | LotSz | LP/SqFt | LP | DIM | Score |
|---|---|---|---|---|---|---|---|---|---|---|
| 3802 Rolling Green Lane | Orange | 1989 | 4 | 5 | 4,931 | 12,236 | $578 | $2.85M | 75 | 81 |
| 9111 Loma | Villa Park | 1991 | 4 | 5 | 5,077 | 14,400 | $541 | $2.75M | 52 | 79 |
| 3434 Woodbine Road | Orange | 1984 | 5 | 5 | 4,782 | 10,000 | $584 | $2.79M | 89 | 74 |
| 10371 Balliet Drive | Villa Park | 1972 | 6 | 4 | 4,426 | 20,160 | $633 | $2.80M | 116 | 53 |
| 18601 Amate | Villa Park | 1966 | 5 | 3 | 3,255 | 20,651 | $829 | $2.70M | 90 | 52 |
| Total: 5 · Average | 4.8 | 4.4 | 4,494.2 | 15,489.4 | $633 | $2.78M | 84.4 | |||
| Median | 4,782 | $2.79M | ||||||||
Closed Properties (5)
Closed Comparables
| Address | City | Year | Date | BD | BTH | SqFt | LotSz | LP | SP | SP/SqFt | SP/LP | DIM | Score |
|---|---|---|---|---|---|---|---|---|---|---|---|---|---|
| 3211 Mandeville Place | Orange | 1981 | 02/13/2026 | 6 | 7 | 5,794 | 18,750 | $2.90M | $2.60M | $449 | 0.90 | 270 | 80 |
| 2710 Vista Ridge | Orange | 2003 | 02/05/2026 | 5 | 5 | 4,345 | 21,021 | $2.80M | $2.71M | $624 | 0.97 | 98 | 75 |
| 18451 Valley | Villa Park | 1989 | 09/10/2026 | 6 | 6 | 4,543 | 30,143 | $3.30M | $3.20M | $704 | 0.97 | 28 | 66 |
| 9631 Fleet Road | Villa Park | 1963 | 01/16/2026 | 5 | 4 | 4,067 | 19,900 | $3.00M | $2.95M | $725 | 0.98 | 72 | 58 |
| 9631 James Circle | Villa Park | 1964 | 11/14/2025 | 4 | 4 | 3,343 | 20,010 | $2.60M | $2.60M | $778 | 1.00 | 63 | 44 |
| Total: 5 · Average | 5.2 | 5.2 | 4,418.4 | 21,964.8 | $2.81M | $2.81M | $656 | — | 106.2 | ||||
| Median | 4,345 | $2.71M | $2.71M | ||||||||||
Market Analysis
List vs Sale $/SqFt
Sale Price Trend
Days on Market
Sale vs List Price
AI-generated CMA
This analysis was generated automatically from MLS data. For an in-depth, human-reviewed valuation, contact Joseph Sardella at josephsardella@gmail.com.