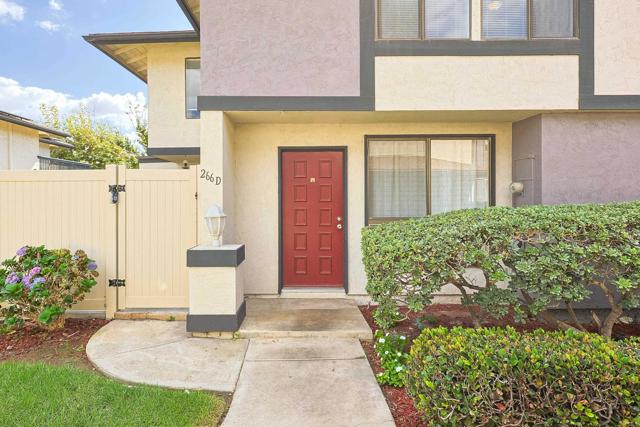
266 Rancho Drive, D, Chula Vista, CA 91911
266 Rancho Drive, D, Chula Vista, CA 91911
Property Description
Move in ready, fresh paint, updated with 3- AC/heat Mini Split units for excellent temperature control. New carpet, updated quarts countertops and cabinets. Large fully fenced patio, 2 extra long assigned parking spots. Washer/dryer hookups in laundry/storage room off the patio. This unit is steps way from the bike ramp park, biking/running/walking trails and acres of valley views. Property is in a PUD so it can go FHA/VA
Features & Amenities
Property Details
Mortgage Calculator
Current Rates
Comparative Market Analysis
Affordable Tier · 5 active · 5 closed
Chula Vista · Condominium
Listed in line with the median closed sale of $575,000. Closed comps sold at 102% of list — strong seller's market.
Price Position
Aligned with the market — fair pricing for the comps.
Active Properties (5)
Active Comparables
| Address | City | Year | BD | BTH | SqFt | LotSz | LP/SqFt | LP | DIM | Score |
|---|---|---|---|---|---|---|---|---|---|---|
| 226 Otay Valley Road | Chula Vista | 1972 | 3 | 2 | 1,212 | 942 | $413 | $499,990 | 15 | 94 |
| 1640 Maple Drive | Chula Vista | 1974 | 3 | 2 | 1,800 | 504,860 | $306 | $549,999 | 125 | 73 |
| 584 Portsmouth Drive | Chula Vista | 1989 | 2 | 3 | 1,257 | 337,590 | $461 | $579,000 | 80 | 71 |
| 760 Portside Pl | San Diego | 2005 | 3 | 3 | 1,400 | 0 | $442 | $619,000 | 29 | 70 |
| 812 Makani St | Chula Vista | 2024 | 2 | 3 | 1,143 | 0 | $521 | $594,999 | 25 | 65 |
| Total: 5 · Average | 2.6 | 2.6 | 1,362.4 | 281,130.667 | $428.6 | $568,597.6 | 54.8 | |||
| Median | 1,257 | $579,000 | ||||||||
Closed Properties (5)
Closed Comparables
| Address | City | Year | Date | BD | BTH | SqFt | LotSz | LP | SP | SP/SqFt | SP/LP | DIM | Score |
|---|---|---|---|---|---|---|---|---|---|---|---|---|---|
| 270 Rancho Drive | Chula Vista | 1977 | 10/06/2026 | 3 | 2 | 1,228 | 871 | $549,900 | $586,000 | $477 | 1.07 | 35 | 97 |
| 303 Rancho Drive | Chula Vista | 1976 | 04/24/2026 | 3 | 2 | 1,274 | 0 | $575,000 | $575,000 | $451 | 1.00 | 37 | 92 |
| 230 Rancho Drive | Chula Vista | 1974 | 04/27/2026 | 3 | 2 | 1,212 | 1,307 | $585,900 | $599,000 | $494 | 1.02 | 34 | 90 |
| 1725 Melrose | Chula Vista | 1981 | 09/28/2026 | 2 | 2 | 1,225 | 187,157 | $535,000 | $535,000 | $437 | 1.00 | 60 | 87 |
| 1720 Melrose | Chula Vista | 1980 | 01/12/2026 | 3 | 3 | 1,414 | 0 | $525,000 | $525,000 | $371 | 1.00 | 109 | 82 |
| Total: 5 · Average | 2.8 | 2.2 | 1,270.6 | 63,111.667 | $564,000 | $564,000 | $446 | — | 55 | ||||
| Median | 1,228 | $575,000 | $575,000 | ||||||||||
Market Analysis
List vs Sale $/SqFt
Sale Price Trend
Days on Market
Sale vs List Price
This analysis was generated automatically from MLS data. For an in-depth, human-reviewed valuation, contact Joseph Sardella at josephsardella@gmail.com.