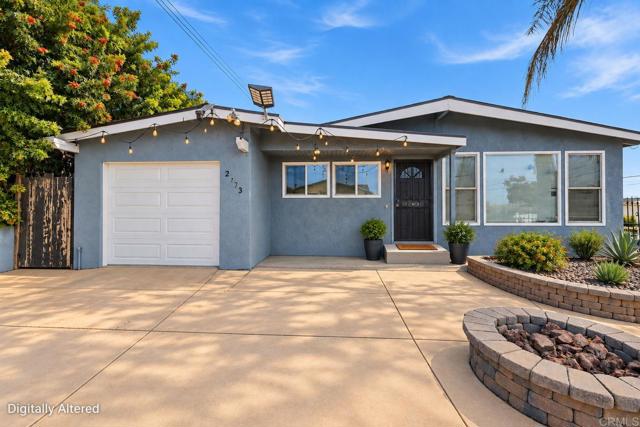
2573 Calle Aguadulce, San Diego, CA 92139
2573 Calle Aguadulce, San Diego, CA 92139
Property Description
2573 Calle Aguadulce, San Diego, CA 92139 Welcome to this charming 3-bedroom, 2-bath single-family home offering approximately 1,353 square feet of living space in the desirable Paradise Hills community. Situated on a generous corner lot, this home offers privacy, outdoor space, and beautiful elevated views. The functional floor plan provides comfortable living areas with plenty of potential to make the home your own. With three bedrooms, two full bathrooms, a spacious lot, and a great location, this property is an excellent opportunity for buyers looking for a true single-family home in San Diego. Conveniently located near shopping, schools, parks, freeways, and everything the South Bay has to offer, while still providing the neighborhood feel buyers love. ? 3 Bedrooms | 2 Bathrooms | Approx. 1,353 Sq. Ft. | Corner Lot | Views | Single-Family Home
Features & Amenities
Property Details
Mortgage Calculator
Current Rates
Comparative Market Analysis
Affordable Tier · 5 active · 5 closed
San Diego · Single Family Residence
Listed 3.9% above the median closed sale of $770,000.
Price Position
Aligned with the market — fair pricing for the comps.
Active Properties (5)
Active Comparables
| Address | City | Year | BD | BTH | SqFt | LotSz | LP/SqFt | LP | DIM | Score |
|---|---|---|---|---|---|---|---|---|---|---|
| 2595 Calle Tres Lomas | San Diego | 1959 | 3 | 2 | 1,233 | 6,500 | $606 | $747,000 | 60 | 92 |
| 2346 Saipan Dri Street | San Diego | 1959 | 3 | 2 | 1,450 | 7,300 | $528 | $765,000 | 27 | 90 |
| 2463 Rancho Drive | San Diego | 1948 | 3 | 2 | 1,185 | 7,200 | $608 | $720,000 | 135 | 87 |
| 2959 Ridgeway Drive | National City | 1931 | 3 | 2 | 1,300 | 7,941 | $576 | $749,000 | 4 | 81 |
| 5949 Tonawanda Drive | San Diego | 1979 | 3 | 2 | 1,568 | 5,486 | $478 | $750,000 | 73 | 80 |
| Total: 5 · Average | 3.0 | 2.0 | 1,347.2 | 6,885.4 | $559.2 | $746,200 | 59.8 | |||
| Median | 1,300 | $749,000 | ||||||||
Closed Properties (5)
Closed Comparables
| Address | City | Year | Date | BD | BTH | SqFt | LotSz | LP | SP | SP/SqFt | SP/LP | DIM | Score |
|---|---|---|---|---|---|---|---|---|---|---|---|---|---|
| 6158 Chadwick | San Diego | 1959 | 10/30/2026 | 3 | 2 | 1,271 | 7,200 | $729,999 | $740,000 | $582 | 1.01 | 44 | 91 |
| 2785 Kausman Street | San Diego | 1960 | 09/18/2026 | 3 | 2 | 1,553 | 0 | $879,900 | $872,500 | $562 | 0.99 | 52 | 88 |
| 2554 Calle Serena | San Diego | 1977 | 10/06/2026 | 4 | 2 | 1,456 | 6,098 | $759,000 | $685,000 | $470 | 0.90 | 72 | 87 |
| 3158 Manos Drive | San Diego | 1974 | 08/27/2026 | 3 | 2 | 1,285 | 4,200 | $770,000 | $770,000 | $599 | 1.00 | 27 | 85 |
| 6127 Winchester Street | San Diego | 1951 | 11/17/2025 | 3 | 2 | 1,072 | 6,000 | $775,000 | $780,000 | $728 | 1.01 | 156 | 83 |
| Total: 5 · Average | 3.2 | 2.0 | 1,327.4 | 5,874.5 | $769,500 | $769,500 | $588.2 | — | 70.2 | ||||
| Median | 1,285 | $770,000 | $770,000 | ||||||||||
Market Analysis
List vs Sale $/SqFt
Sale Price Trend
Days on Market
Sale vs List Price
This analysis was generated automatically from MLS data. For an in-depth, human-reviewed valuation, contact Joseph Sardella at josephsardella@gmail.com.