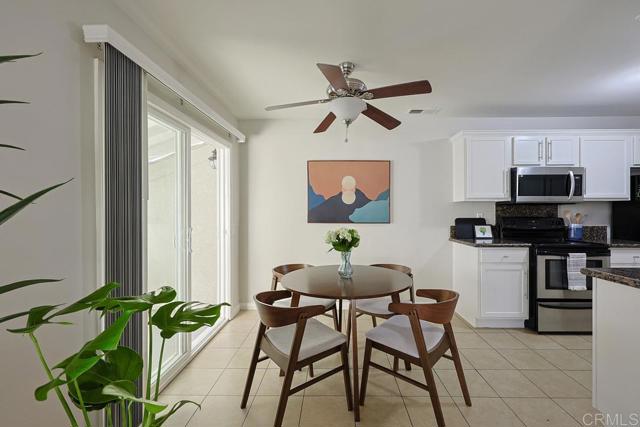
255 South 2nd Street, 6, El Cajon, CA 92019
255 South 2nd Street, 6, El Cajon, CA 92019
Property Description
Updated and refreshed, 3 bedroom, 2 bathroom upstairs condo. Currently Lowest Priced 3 bedroom Condo in 92019. Great value. New paint, flooring, kitchen hardware, new dishwasher, and lighting features all a year old. Bedrooms are large, great natural light throughout and lovely covered patio/ deck off the kitchen. This is a gated building with 1 marked uncovered parking space. Unit is centrally location and walking distance to shopping
Features & Amenities
Property Details
Mortgage Calculator
Current Rates
Comparative Market Analysis
Affordable Tier · 5 active · 5 closed
El Cajon · Condominium
Listed 7.2% below the median closed sale of $430,000.
Price Position
Priced below the market — value advantage over the field.
Active Properties (5)
Active Comparables
| Address | City | Year | BD | BTH | SqFt | LotSz | LP/SqFt | LP | DIM | Score |
|---|---|---|---|---|---|---|---|---|---|---|
| 390 N 1st St | El Cajon | 1990 | 2 | 2 | 896 | 44,867 | $402 | $359,999 | 79 | 84 |
| 1386 Madison Avenue | El Cajon | 1990 | 2 | 2 | 814 | 0 | $479 | $390,000 | 50 | 83 |
| 1509 Washington Ave | El Cajon | 1986 | 2 | 2 | 848 | 0 | $495 | $420,000 | 220 | 78 |
| 487 Lincoln Avenue | El Cajon | 1981 | 2 | 1 | 928 | 68,389 | $463 | $430,000 | 69 | 68 |
| 732 Lexington Avenue | El Cajon | 1978 | 1 | 1 | 785 | 1 | $446 | $350,000 | 88 | 66 |
| Total: 5 · Average | 1.8 | 1.6 | 854.2 | 37,752.333 | $457 | $389,999.8 | 101.2 | |||
| Median | 848 | $390,000 | ||||||||
Closed Properties (5)
Closed Comparables
| Address | City | Year | Date | BD | BTH | SqFt | LotSz | LP | SP | SP/SqFt | SP/LP | DIM | Score |
|---|---|---|---|---|---|---|---|---|---|---|---|---|---|
| 255 2nd Street | El Cajon | 2000 | 01/23/2026 | 3 | 2 | 1,065 | 51,592 | $469,999 | $440,000 | $413 | 0.94 | 49 | 94 |
| 1123 DECKER Street | El Cajon | 1985 | 09/25/2026 | 2 | 2 | 1,072 | 0 | $429,000 | $436,000 | $407 | 1.02 | 52 | 87 |
| 1166 Decker Street | El Cajon | 1982 | 07/17/2026 | 2 | 2 | 1,232 | 1 | $435,000 | $430,000 | $349 | 0.99 | 50 | 80 |
| 389 Shady Ln | El Cajon | 1981 | 04/03/2026 | 2 | 3 | 1,050 | 0 | $429,999 | $420,000 | $400 | 0.98 | 52 | 80 |
| 514 Jamacha Road | El Cajon | 1985 | 11/18/2025 | 2 | 2 | 1,162 | 0 | $449,000 | $385,000 | $331 | 0.86 | 106 | 80 |
| Total: 5 · Average | 2.2 | 2.2 | 1,116.2 | 25,796.5 | $422,200 | $422,200 | $380 | — | 61.8 | ||||
| Median | 1,072 | $430,000 | $430,000 | ||||||||||
Market Analysis
List vs Sale $/SqFt
Sale Price Trend
Days on Market
Sale vs List Price
This analysis was generated automatically from MLS data. For an in-depth, human-reviewed valuation, contact Joseph Sardella at josephsardella@gmail.com.