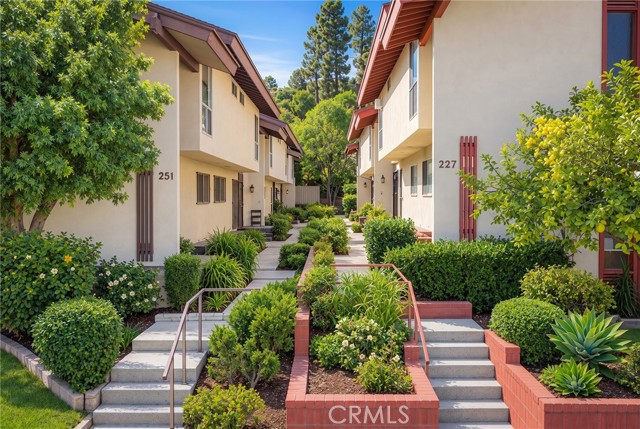
251 Casuda Canyon, E, Monterey Park, CA 91754
251 Casuda Canyon, E, Monterey Park, CA 91754
Property Description
Welcome to 251 Casuda Canyon Rd! This spacious Monterey Park townhome features an updated kitchen and bathrooms, a generous multi-level floor plan, and abundant natural light. Enjoy two oversized balconies, providing wonderful outdoor space for relaxing, entertaining, or enjoying your morning coffee. The lower level offers a versatile bonus area with a sink, ideal for a home office, exercise room, hobby space, or additional living area. Conveniently located within walking distance to schools and close to shopping, dining, parks, and major transportation routes. With spacious interiors, flexible living areas, and exceptional outdoor space, this home offers plenty of possibilities to make it your own.
Features & Amenities
Property Details
Mortgage Calculator
Current Rates
Comparative Market Analysis
Residential Tier · 5 active · 5 closed
Monterey Park · Townhouse
Listed in line with the median closed sale of $699,888. Price per sqft ($417) is a 15% discount to closed comps ($488).
Price Position
Aligned with the market — fair pricing for the comps.
Active Properties (5)
Active Comparables
| Address | City | Year | BD | BTH | SqFt | LotSz | LP/SqFt | LP | DIM | Score |
|---|---|---|---|---|---|---|---|---|---|---|
| 1818 Garvey Avenue | Alhambra | 1979 | 3 | 3 | 1,442 | 85,576 | $512 | $738,000 | 100 | 79 |
| 108 Moore Avenue | Monterey Park | 1981 | 3 | 3 | 1,502 | 19,979 | $485 | $729,000 | 29 | 79 |
| 1822 Garvey | Alhambra | 1980 | 3 | 3 | 1,409 | 986 | $490 | $689,888 | 88 | 79 |
| 417 Baltimore Avenue | Monterey Park | 1987 | 4 | 4 | 1,743 | 18,947 | $441 | $768,000 | 12 | 76 |
| 1816 Garvey Avenue | Alhambra | 1979 | 2 | 3 | 1,194 | 85,576 | $557 | $665,000 | 100 | 74 |
| Total: 5 · Average | 3.0 | 3.2 | 1,458 | 42,212.8 | $497 | $717,977.6 | 65.8 | |||
| Median | 1,442 | $729,000 | ||||||||
Closed Properties (5)
Closed Comparables
| Address | City | Year | Date | BD | BTH | SqFt | LotSz | LP | SP | SP/SqFt | SP/LP | DIM | Score |
|---|---|---|---|---|---|---|---|---|---|---|---|---|---|
| 226 Chandler | Monterey Park | 1983 | 10/09/2026 | 3 | 3 | 1,449 | 20,682 | $750,000 | $778,000 | $537 | 1.04 | 79 | 78 |
| 511 Mcpherrin Avenue | Monterey Park | 1984 | 10/15/2026 | 3 | 3 | 1,561 | 19,769 | $749,000 | $749,000 | $480 | 1.00 | 84 | 78 |
| 1826 Garvey Ave | Alhambra | 1980 | 12/31/2025 | 3 | 3 | 1,498 | 984 | $699,888 | $699,888 | $467 | 1.00 | 54 | 77 |
| 900 Mabel ave | Monterey Park | 1979 | 09/11/2026 | 2 | 3 | 1,425 | 1,350 | $688,000 | $650,000 | $456 | 0.94 | 53 | 71 |
| 322 Huntington | Monterey Park | 1981 | 02/19/2026 | 3 | 3 | 1,385 | 13,565 | $698,000 | $695,000 | $502 | 1.00 | 39 | 70 |
| Total: 5 · Average | 2.8 | 3.0 | 1,463.6 | 11,270 | $714,377.6 | $714,377.6 | $488.4 | — | 61.8 | ||||
| Median | 1,449 | $699,888 | $699,888 | ||||||||||
Market Analysis
List vs Sale $/SqFt
Sale Price Trend
Days on Market
Sale vs List Price
This analysis was generated automatically from MLS data. For an in-depth, human-reviewed valuation, contact Joseph Sardella at josephsardella@gmail.com.