1 / 35
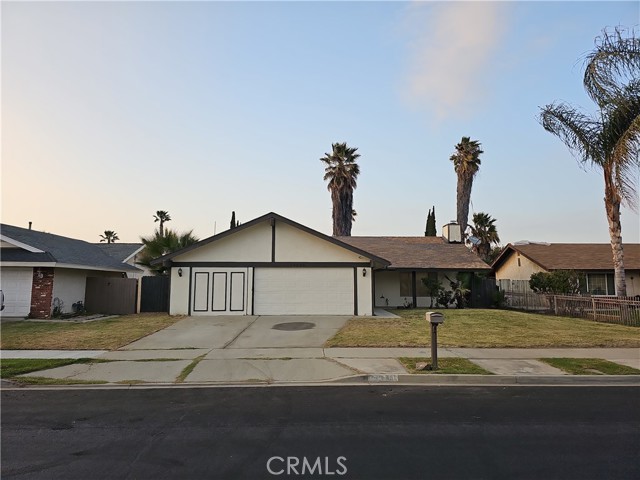
24446 Via Del Sol Street, Moreno Valley, CA 92553
$509K3bd · 2ba · 1,495 sqft
Lot 7,405 sqft•Single Family Residence•Active•1277d on market•MLS# PW-23077727
24446 Via Del Sol Street, Moreno Valley, CA 92553
MLS# PW-23077727•Residential•Single Family Residence
Active1277 days on market
$509,000
3
Beds
2
Baths
1,495
Sq Ft
7,405
Lot Sq Ft
1978
Year Built
None
View
Property Description
Excellent Location Close to everything full remodeld Kitchen Baths Ceilings bring your buyers
Features & Amenities
FeeBuilt 1978
Property Details
Land Type
Fee
Year Built
1978
Property Type
Residential
Property Subtype
Single Family Residence
Parking Spaces
2
Garage Spaces
2
Heating
Central
Cooling
Central Air
View
None
Flooring
Tile
City
Moreno Valley
Zip Code
92553
County
Riverside
Mortgage Calculator
Current Rates
$
$
%
Monthly Payment
$2,573.78
Principal & Interest
Loan Amount
$407,200
Total Interest
$519,361
Total Payment Over 30 Years
$926,561
This calculator provides estimates only. Actual mortgage payments may include taxes, insurance, HOA fees, and PMI. Contact a lender for accurate quotes.
Comparative Market Analysis
Affordable Tier · 5 active · 5 closed
24446 Via Del Sol Street, Moreno Valley, CA 92553
Moreno Valley · Single Family Residence
$509K
Affordable TierBeds
3
Baths
2
Sqft
1,495
Lot
7,405 sqft
Year
1978
$/Sqft
$340
Pool: No✓
View: None✓
Garage: 2-car✓
Listed in line with the median closed sale of $520,000. Price per sqft ($340) is a 11% discount to closed comps ($380). Closed comps sold at 103% of list — strong seller's market.
Price Position
Aligned with the market — fair pricing for the comps.
At market
Subject listed at $509K· $340/sqft
Total list price
Closed comps
vs closed median $520K
−$11K (−2.1%)
Active comps
vs active median $499K
+$10K (+2.0%)
Price per sqft
Closed compsinsufficient comp data
Active comps
vs active avg $/sqft $357
−$17 (−4.7%)
Active Properties (5)
Active Comparables
| Address | City | Year | BD | BTH | SqFt | LotSz | LP/SqFt | LP | DIM | Score |
|---|---|---|---|---|---|---|---|---|---|---|
| 13579 Ramsdell Drive | Moreno Valley | 1972 | 4 | 2 | 1,342 | 6,970 | $409 | $549,000 | 4 | 91 |
| 24230 Horton Court | Moreno Valley | 1980 | 3 | 2 | 1,318 | 7,405 | $379 | $499,000 | 16 | 90 |
| 24117 Aylesbury | Moreno Valley | 1984 | 3 | 2 | 989 | 3,485 | $479 | $474,000 | 82 | 83 |
| 13867 Calada Drive | Moreno Valley | 1983 | 4 | 3 | 1,931 | 7,405 | $272 | $524,950 | 17 | 82 |
| 24361 Bion | Moreno Valley | 1971 | 5 | 3 | 1,902 | 6,970 | $244 | $465,000 | 138 | 80 |
| Total: 5 · Average | 3.8 | 2.4 | 1,496.4 | 6,447 | $356.6 | $502,390 | 51.4 | |||
| Median | 1,342 | $499,000 | ||||||||
Closed Properties (5)
Closed Comparables
| Address | City | Year | Date | BD | BTH | SqFt | LotSz | LP | SP | SP/SqFt | SP/LP | DIM | Score |
|---|---|---|---|---|---|---|---|---|---|---|---|---|---|
| 24685 Willet | Moreno Valley | 1985 | 10/15/2026 | 3 | 2 | 1,512 | 6,970 | $500,000 | $520,000 | $344 | 1.04 | 48 | 95 |
| 24335 Sykes | Moreno Valley | 1975 | 09/09/2026 | 3 | 2 | 1,260 | 7,405 | $499,000 | $520,000 | $413 | 1.04 | 92 | 93 |
| 13854 Robin Nest Court | Moreno Valley | 1985 | 07/13/2026 | 3 | 2 | 1,512 | 8,276 | $535,000 | $555,000 | $367 | 1.04 | 43 | 93 |
| 24448 Dorner | Moreno Valley | 1975 | 08/11/2026 | 4 | 2 | 1,342 | 7,841 | $549,000 | $559,000 | $417 | 1.02 | 63 | 92 |
| 24161 Delgado Court | Moreno Valley | 1980 | 09/18/2026 | 3 | 2 | 1,318 | 6,970 | $458,000 | $470,000 | $357 | 1.03 | 30 | 91 |
| Total: 5 · Average | 3.2 | 2.0 | 1,388.8 | 7,492.4 | $524,800 | $524,800 | $379.6 | — | 55.2 | ||||
| Median | 1,342 | $520,000 | $520,000 | ||||||||||
Market Analysis
List vs Sale $/SqFt
Sale Price Trend
Days on Market
Sale vs List Price
AI-generated CMA
This analysis was generated automatically from MLS data. For an in-depth, human-reviewed valuation, contact Joseph Sardella at josephsardella@gmail.com.