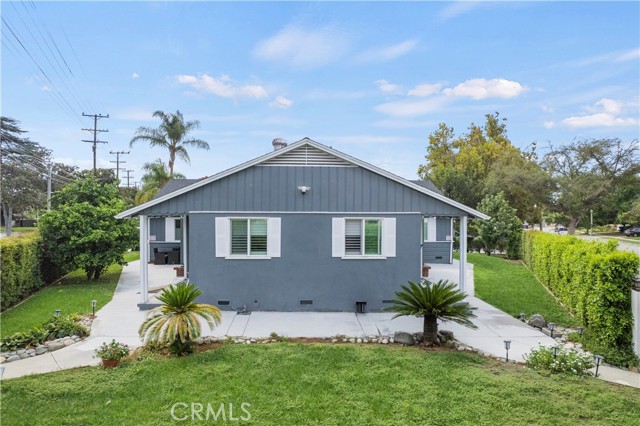
241 North San Marino, San Gabriel, CA 91775
241 North San Marino, San Gabriel, CA 91775
Property Description
One lot with two mirrored homes! Located in the heart of North San Gabriel, this unique property features two separate homes on a single parcel, complete with distinct addresses(241 N San Marino Ave and 240 N Santa Anita St) and fully independent utility meters (water, gas, and electricity). Spanning 2,572 square feet of total living space on an expansive lot of nearly 10,000 square feet, each residence offers 2 bedrooms and 1 full bathroom. Both homes feature upgraded electrical panels, brand-new plumbing, and central HVAC systems. The property has undergone a comprehensive, top-to-bottom renovation inside and out. Designed with a back-to-back mirrored layout, this property offers incredible versatility. It is ideal for dual-rental income, an owner-occupant looking to live in one unit while renting out the other, or a multi-generational family seeking shared living while maintaining total privacy. Move-in ready and truly one-of-a-kind, this exceptional home is ready for its new owner.
Features & Amenities
Property Details
Mortgage Calculator
Current Rates
Comparative Market Analysis
Residential Tier · 3 active · 5 closed
San Gabriel · Duplex
Listed in line with the median closed sale of $1,470,000. Closed comps sold at 108% of list — strong seller's market.
Price Position
Aligned with the market — fair pricing for the comps.
Active Properties (3)
Active Comparables
| Address | City | Year | BD | BTH | SqFt | LotSz | LP/SqFt | LP | DIM | Score |
|---|---|---|---|---|---|---|---|---|---|---|
| 417 Fairview Ave | San Gabriel | 1950 | 4 | 3 | 2,185 | 7,495 | $618 | $1.35M | 26 | 77 |
| 301 Adams Avenue | Alhambra | 1923 | 4 | 2 | 1,342 | 6,454 | $1,039 | $1.40M | 75 | 62 |
| 127 Glendon | San Gabriel | 1940 | 5 | 4 | 2,075 | 6,545 | $650 | $1.35M | 61 | 61 |
| Total: 3 · Average | 4.3 | 3.0 | 1,867.333 | 6,831.333 | $769 | $1.36M | 54 | |||
| Median | 2,075 | $1.35M | ||||||||
Closed Properties (5)
Closed Comparables
| Address | City | Year | Date | BD | BTH | SqFt | LotSz | LP | SP | SP/SqFt | SP/LP | DIM | Score |
|---|---|---|---|---|---|---|---|---|---|---|---|---|---|
| 508 Hidalgo | Alhambra | 1939 | 11/14/2025 | 4 | 2 | 2,713 | 15,787 | $1.55M | $1.68M | $619 | 1.08 | 41 | 73 |
| 228 El Molino | Alhambra | 1923 | 05/08/2026 | 2 | 2 | 1,922 | 10,525 | $1.19M | $1.47M | $765 | 1.24 | 25 | 71 |
| 3344 Charlotte Avenue | Rosemead | 1940 | 05/28/2026 | 5 | 2 | 2,527 | 9,996 | $1.17M | $1.35M | $534 | 1.15 | 62 | 68 |
| 270 Bencamp | San Gabriel | 1948 | 09/24/2026 | 6 | 4 | 2,229 | 8,616 | $1.37M | $1.30M | $583 | 0.95 | 42 | 64 |
| 104 Linda Vista Avenue | Alhambra | 2024 | 10/01/2026 | 6 | 8 | 2,793 | 7,830 | $1.66M | $1.61M | $576 | 0.97 | 101 | 60 |
| Total: 5 · Average | 4.6 | 3.6 | 2,436.8 | 10,550.8 | $1.48M | $1.48M | $615.4 | — | 54.2 | ||||
| Median | 2,527 | $1.47M | $1.47M | ||||||||||
Market Analysis
List vs Sale $/SqFt
Sale Price Trend
Days on Market
Sale vs List Price
This analysis was generated automatically from MLS data. For an in-depth, human-reviewed valuation, contact Joseph Sardella at josephsardella@gmail.com.