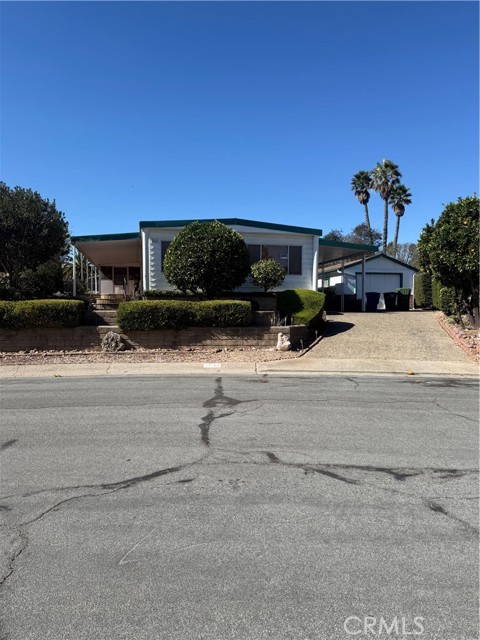
1 / 19
241 Lema Court, Nipomo, CA 93444
$470K2bd · 2ba · 1,440 sqft
Lot 7,000 sqft•Manufactured On Land•Active•16d on market•MLS# PI-26213713
241 Lema Court, Nipomo, CA 93444
MLS# PI-26213713•Residential•Manufactured On Land
Active16 days on market
$470,000
2
Beds
2
Baths
1,440
Sq Ft
7,000
Lot Sq Ft
1972
Year Built
None
View
Property Description
Location location, location …Manufacture home on a lot. No H O A. Sunroom on the porch and garden area in back some trees already planted. The room in the back of the garage could be a perfect workshop. This is a must see. Great lot and home.
Features & Amenities
FeeBuilt 1972
Property Details
Land Type
Fee
Year Built
1972
Property Type
Residential
Property Subtype
Manufactured On Land
Parking Spaces
2
Garage Spaces
1
Cooling
Dual
View
None
City
Nipomo
Zip Code
93444
County
San Luis Obispo
Mortgage Calculator
Current Rates
$
$
%
Monthly Payment
$2,376.58
Principal & Interest
Loan Amount
$376,000
Total Interest
$479,567
Total Payment Over 30 Years
$855,567
This calculator provides estimates only. Actual mortgage payments may include taxes, insurance, HOA fees, and PMI. Contact a lender for accurate quotes.
Comparative Market Analysis
Affordable Tier · 0 active · 5 closed
241 Lema Court, Nipomo, CA 93444
Nipomo · Manufactured On Land
$470K
Affordable TierBeds
2
Baths
2
Sqft
1,440
Lot
7,000 sqft
Year
1972
$/Sqft
$326
Pool: No✓
View: None✓
Garage: 1-car✓
Listed 8.0% above the median closed sale of $435,000. Price per sqft ($326) is a 12% premium to closed comps ($290).
Price Position
Positioned above the market — commands a premium.
Premium
Subject listed at $470K· $326/sqft
Total list price
Closed comps
vs closed median $435K
+$35K (+8.0%)
Active compsinsufficient comp data
Price per sqft
Closed compsinsufficient comp data
Active compsinsufficient comp data
Closed Properties (5)
Closed Comparables
| Address | City | Year | Date | BD | BTH | SqFt | LotSz | LP | SP | SP/SqFt | SP/LP | DIM | Score |
|---|---|---|---|---|---|---|---|---|---|---|---|---|---|
| 217 Hope Way | Nipomo | 1972 | 01/15/2026 | 2 | 2 | 1,368 | 7,620 | $450,000 | $435,000 | $318 | 0.97 | 91 | 89 |
| 255 Encino Lane | Nipomo | 1979 | 03/03/2026 | 2 | 2 | 1,344 | 6,513 | $429,000 | $435,000 | $324 | 1.01 | 199 | 86 |
| 361 Jupiter Drive | Nipomo | 1975 | 06/18/2026 | 2 | 2 | 1,344 | 6,098 | $375,000 | $405,000 | $301 | 1.08 | 52 | 84 |
| 777 Palmer Street | Nipomo | 1977 | 01/16/2026 | 2 | 2 | 1,746 | 6,400 | $488,000 | $500,000 | $286 | 1.02 | 41 | 84 |
| 262 Lema Drive | Nipomo | 1976 | 11/12/2025 | 2 | 2 | 2,016 | 6,220 | $499,000 | $442,910 | $220 | 0.89 | 46 | 82 |
| Total: 5 · Average | 2.0 | 2.0 | 1,563.6 | 6,570.2 | $443,582 | $443,582 | $289.8 | — | 85.8 | ||||
| Median | 1,368 | $435,000 | $435,000 | ||||||||||
Market Analysis
List vs Sale $/SqFt
Sale Price Trend
Days on Market
Sale vs List Price
AI-generated CMA
This analysis was generated automatically from MLS data. For an in-depth, human-reviewed valuation, contact Joseph Sardella at josephsardella@gmail.com.