23524 Arlington, Torrance, CA 90501
23524 Arlington, Torrance, CA 90501
Property Description
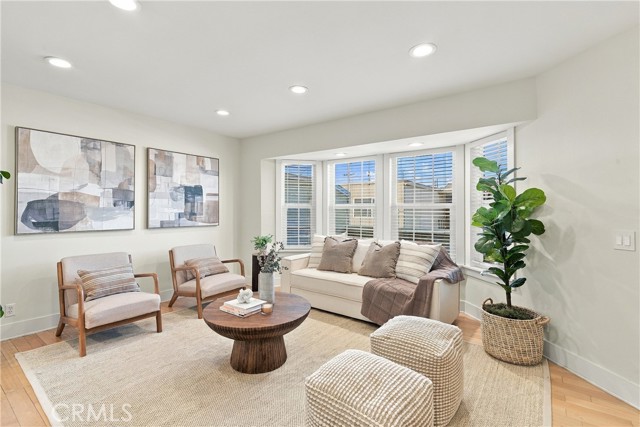
Two primary style suites, an oversized private patio, and a direct access two car side by side garage in Torrance. Each suite has its own full bath, vaulted ceilings and a walk in closet. The primary suite opens to a private balcony with city light views. The spacious living room with a fireplace opens to the oversized patio, perfect for outdoor dining and entertaining. A flex space off the kitchen works as a home office, reading nook or homework station, and a powder room serves guests. Double pane windows, a Ring doorbell, and extra storage in the garage. Torrance Unified School District. Close to shopping, dining and freeways.
Features & Amenities
Property Details
Mortgage Calculator
Current Rates
Comparative Market Analysis
Affordable Tier · 5 active · 5 closed
Torrance · Townhouse
Listed 6.8% below the median closed sale of $750,000.
Price Position
Priced below the market — value advantage over the field.
Active Properties (5)
Active Comparables
| Address | City | Year | BD | BTH | SqFt | LotSz | LP/SqFt | LP | DIM | Score |
|---|---|---|---|---|---|---|---|---|---|---|
| 2333 241st Street | Lomita | 1979 | 2 | 2 | 1,132 | 64,731 | $574 | $650,000 | 15 | 87 |
| 2513 Apple Avenue | Torrance | 2002 | 2 | 3 | 1,074 | 22,404 | $684 | $735,000 | 4 | 83 |
| 2800 Plaza Del Amo | Torrance | 1987 | 2 | 3 | 1,088 | 143,931 | $716 | $779,000 | 61 | 80 |
| 2800 Plaza Del Amo | Torrance | 1988 | 2 | 3 | 1,088 | 198,049 | $734 | $799,000 | 67 | 80 |
| 1608 226th | Torrance | 2006 | 3 | 3 | 1,130 | 7,205 | $540 | $610,000 | 118 | 75 |
| Total: 5 · Average | 2.2 | 2.8 | 1,102.4 | 87,264 | $649.6 | $714,600 | 53 | |||
| Median | 1,088 | $735,000 | ||||||||
Closed Properties (5)
Closed Comparables
| Address | City | Year | Date | BD | BTH | SqFt | LotSz | LP | SP | SP/SqFt | SP/LP | DIM | Score |
|---|---|---|---|---|---|---|---|---|---|---|---|---|---|
| 2114 Lincoln | Torrance | 1984 | 06/12/2026 | 2 | 2 | 1,003 | 7,001 | $679,000 | $679,000 | $677 | 1.00 | 57 | 84 |
| 2513 Apple Ave | Torrance | 2002 | 08/17/2026 | 2 | 3 | 1,074 | 22,404 | $750,000 | $750,000 | $698 | 1.00 | 89 | 82 |
| 2314 241st | Lomita | 1989 | 08/26/2026 | 3 | 3 | 1,303 | 96,942 | $755,000 | $750,000 | $576 | 0.99 | 47 | 81 |
| 2201 237th Street | Torrance | 2018 | 08/27/2026 | 2 | 3 | 970 | 28,097 | $725,000 | $705,000 | $727 | 0.97 | 66 | 81 |
| 2362 241st | Lomita | 1989 | 04/10/2026 | 3 | 3 | 1,312 | 96,942 | $759,000 | $759,000 | $579 | 1.00 | 86 | 79 |
| Total: 5 · Average | 2.4 | 2.8 | 1,132.4 | 50,277.2 | $728,600 | $728,600 | $651.4 | — | 69 | ||||
| Median | 1,074 | $750,000 | $750,000 | ||||||||||
Market Analysis
List vs Sale $/SqFt
Sale Price Trend
Days on Market
Sale vs List Price
This analysis was generated automatically from MLS data. For an in-depth, human-reviewed valuation, contact Joseph Sardella at josephsardella@gmail.com.