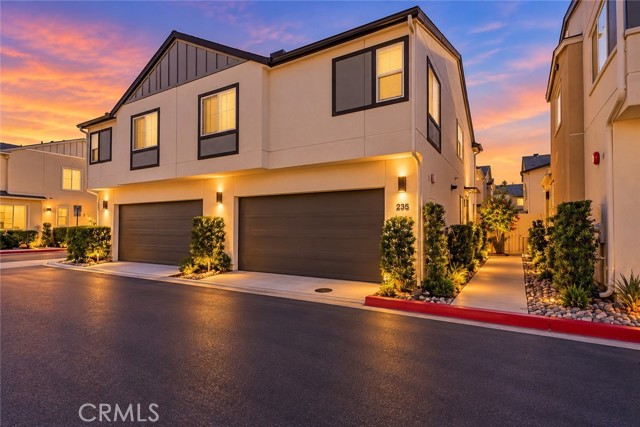
235 Woodland Place, Fallbrook, CA 92028
235 Woodland Place, Fallbrook, CA 92028
Property Description
Welcome to Citro! This well-maintained townhome offers a a very open floor plan, plenty of upgrades, and PAID SOLAR. The kitchen features white cabinetry, granite countertops, tile backsplash, stainless steel appliances, and a double oven. The main living area has upgraded laminate flooring, and the staircase features tile steps and modern black handrails. Upstairs, the primary bedroom includes updated lighting and a ceiling fan and is plenty large enough for a retreat. The private bathroom features granite countertops and lots of natural light. 3 additional bedrooms, a hallway bath and laundry are all on the same level. The private backyard offers space for outdoor dining, barbecuing, and relaxing. Citro/ Horse Creek Ridge offers a variety of community amenities and is conveniently located near shopping, dining, parks, and commuter routes. With paid solar, numerous upgrades, and a private backyard, this townhome is a great opportunity in a popular Fallbrook community.
Features & Amenities
Property Details
Mortgage Calculator
Current Rates
About Fallbrook
This property is located in Fallbrook, a community in Fallbrook. Explore more listings in this neighborhood to compare options and pricing.
View Fallbrook ListingsComparative Market Analysis
Residential Tier · 3 active · 5 closed
Fallbrook · Fallbrook · Townhouse
Listed 6.0% above the median closed sale of $585,000. Expect a longer timeline — comps averaged 129 days on market.
Price Position
Positioned above the market — commands a premium.
Active Properties (3)
Active Comparables
| Address | City | Year | BD | BTH | SqFt | LotSz | LP/SqFt | LP | DIM | Score |
|---|---|---|---|---|---|---|---|---|---|---|
| 35104 Crop Place | Fallbrook | 2024 | 3 | 3 | 1,471 | 0 | $407 | $599,000 | 24 | 88 |
| 308 SEEDLING WAY | Fallbrook | 2023 | 3 | 3 | 1,283 | 0 | $421 | $540,000 | 27 | 73 |
| 311 SATSUMA TRAIL | Fallbrook | 2023 | 3 | 3 | 1,185 | 0 | $456 | $540,000 | 23 | 72 |
| Total: 3 · Average | 3.0 | 3.0 | 1,313 | 0 | $428 | $559,666.667 | 24.666666666666668 | |||
| Median | 1,283 | $540,000 | ||||||||
Closed Properties (5)
Closed Comparables
| Address | City | Year | Date | BD | BTH | SqFt | LotSz | LP | SP | SP/SqFt | SP/LP | DIM | Score |
|---|---|---|---|---|---|---|---|---|---|---|---|---|---|
| 355 CITRINE TRAIL | Fallbrook | 2022 | 09/30/2026 | 3 | 3 | 1,283 | 0 | $550,000 | $550,000 | $429 | 1.00 | 202 | 73 |
| 323 CITRINE TRAIL | Fallbrook | 2022 | 01/26/2026 | 4 | 3 | 1,471 | 0 | $605,000 | $605,000 | $411 | 1.00 | 112 | 73 |
| 332 Seedling Way | Fallbrook | 2023 | 12/02/2025 | 3 | 3 | 1,471 | 0 | $629,000 | $649,500 | $442 | 1.03 | 105 | 71 |
| 35103 Vine Place | Fallbrook | 2022 | 07/14/2026 | 4 | 3 | 1,471 | 43,560 | $579,000 | $579,000 | $394 | 1.00 | 126 | 68 |
| 1718 Tecalote Drive | Fallbrook | 1990 | 07/13/2026 | 3 | 3 | 1,848 | 228,568 | $609,900 | $585,000 | $317 | 0.96 | 101 | 68 |
| Total: 5 · Average | 3.4 | 3.0 | 1,508.8 | 136,064 | $593,700 | $593,700 | $398.6 | — | 129.2 | ||||
| Median | 1,471 | $585,000 | $585,000 | ||||||||||
Market Analysis
List vs Sale $/SqFt
Sale Price Trend
Days on Market
Sale vs List Price
This analysis was generated automatically from MLS data. For an in-depth, human-reviewed valuation, contact Joseph Sardella at josephsardella@gmail.com.