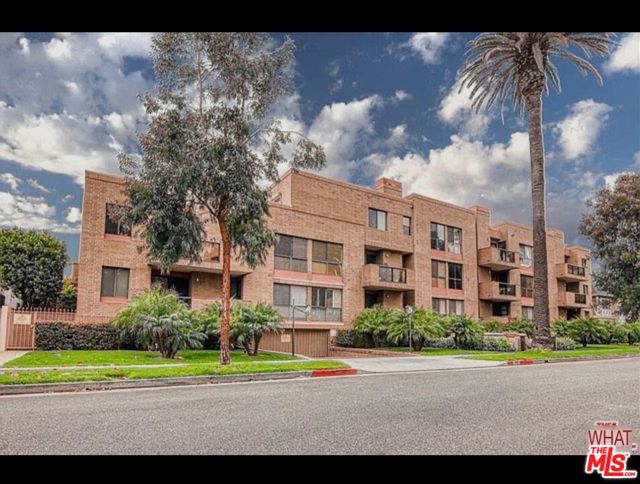
235 South Tower Drive, 306, Beverly Hills, CA 90211
235 South Tower Drive, 306, Beverly Hills, CA 90211
Property Description
ELEGANT BEVERLY HILLS PENTHOUSE IN PRESTIGIOUS 'HAMPTONS' COMPLEX WITH TOP FLOOR VIEWS YET INCREDIBLY QUIET. 2BED/2BATH PLUS DEN. VERY SPACIOUS AND BRIGHT CORNER & TOP FLOOR UNIT. HARDWOOD FLOORS IN ONE OF THE BEDROOMS. MARBLE FLOOR IN BATHROOMS AND HALLWAY. CARPET IN THE LIVING ROOM. 2 LARGE WALK-IN CLOSETS IN MASTER. GRANITE KITCHEN. BUILT-INS. WET BAR. EXTRA LARGE STORAGE. 2 SIDE-BY-SIDE PARKING. SECURITY. AMENITIES: POOL, SPA, SAUNA, EXERCISE ROOM. HOA INCLUDES EQ. EASY TO SHOW. ONE MOST PRESTIGOUS NEIGHBORHOODS IN L.A. MORE PROFESSIONAL PICTURES TO COME SOON.
Features & Amenities
Property Details
Mortgage Calculator
Current Rates
Comparative Market Analysis
Residential Tier · 5 active · 5 closed
Beverly Hills · Condominium
Listed 5.9% above the median closed sale of $925,000. Expect a longer timeline — comps averaged 143 days on market.
Price Position
Positioned above the market — commands a premium.
Active Properties (5)
Active Comparables
| Address | City | Year | BD | BTH | SqFt | LotSz | LP/SqFt | LP | DIM | Score |
|---|---|---|---|---|---|---|---|---|---|---|
| 235 Tower | Beverly Hills | 1988 | 3 | 2 | 1,533 | 24,023 | $717 | $1.10M | 30 | 90 |
| 321 San Vicente Boulevard | Los Angeles | 1976 | 2 | 2 | 1,295 | 0 | $771 | $999,000 | 20 | 86 |
| 1240 Corning Street | Los Angeles | 1989 | 2 | 2 | 1,312 | 19,593 | $647 | $849,000 | 104 | 84 |
| 8568 Burton Way | Los Angeles | 1974 | 2 | 2 | 1,773 | 28,344 | $618 | $1.09M | 46 | 79 |
| 750 Spaulding Avenue | Los Angeles | 1981 | 2 | 2 | 1,308 | 116,505 | $649 | $849,000 | 2 | 78 |
| Total: 5 · Average | 2.2 | 2.0 | 1,444.2 | 47,116.25 | $680.4 | $978,200 | 40.4 | |||
| Median | 1,312 | $999,000 | ||||||||
Closed Properties (5)
Closed Comparables
| Address | City | Year | Date | BD | BTH | SqFt | LotSz | LP | SP | SP/SqFt | SP/LP | DIM | Score |
|---|---|---|---|---|---|---|---|---|---|---|---|---|---|
| 235 Tower Drive | Beverly Hills | 1988 | 09/18/2026 | 3 | 2 | 1,516 | 24,023 | $1.10M | $1.08M | $712 | 0.98 | 156 | 90 |
| 234 Gale Drive | Beverly Hills | 1989 | 07/31/2026 | 2 | 3 | 1,421 | 26,040 | $988,000 | $988,000 | $695 | 1.00 | 105 | 86 |
| 8568 Burton Way | Los Angeles | 1974 | 08/03/2026 | 2 | 2 | 1,786 | 28,344 | $899,999 | $850,000 | $476 | 0.94 | 136 | 85 |
| 8642 Gregory Way | Los Angeles | 1980 | 07/06/2026 | 2 | 2 | 1,719 | 17,397 | $949,000 | $925,000 | $538 | 0.97 | 179 | 81 |
| 8712 Gregory Way | Los Angeles | 1980 | 10/14/2026 | 2 | 3 | 1,635 | 12,313 | $889,000 | $864,000 | $528 | 0.97 | 140 | 80 |
| Total: 5 · Average | 2.2 | 2.4 | 1,615.4 | 21,623.4 | $941,400 | $941,400 | $589.8 | — | 143.2 | ||||
| Median | 1,635 | $925,000 | $925,000 | ||||||||||
Market Analysis
List vs Sale $/SqFt
Sale Price Trend
Days on Market
Sale vs List Price
This analysis was generated automatically from MLS data. For an in-depth, human-reviewed valuation, contact Joseph Sardella at josephsardella@gmail.com.