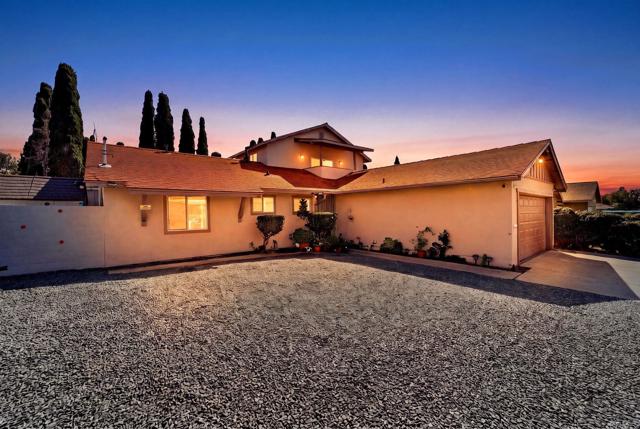
2334 East Division Street, National City, CA 91950
2334 East Division Street, National City, CA 91950
Property Description
Beautifully upgraded and move-in ready, this spacious home features two primary suites, including a private upstairs retreat with a balcony overlooking the city. The remodeled kitchen and bathrooms bring a fresh, modern feel throughout—truly a must-see! The oversized front yard has room for several vehicles, recreational toys, or up to two RVs, plus a two-car garage. The backyard also features a mature guava tree. Ideally located near public transportation, shopping, and freeway access.
Features & Amenities
Property Details
Mortgage Calculator
Current Rates
Comparative Market Analysis
Residential Tier · 5 active · 5 closed
National City · Single Family Residence
Listed 8.5% above the median closed sale of $875,000. Price per sqft ($503) is a 10% premium to closed comps ($456). Closed comps sold at 101% of list — strong seller's market.
Price Position
Positioned above the market — commands a premium.
Active Properties (5)
Active Comparables
| Address | City | Year | BD | BTH | SqFt | LotSz | LP/SqFt | LP | DIM | Score |
|---|---|---|---|---|---|---|---|---|---|---|
| 5472 San Onofre | San Diego | 1957 | 4 | 2 | 1,800 | 7,600 | $500 | $900,000 | 122 | 84 |
| 3140 2nd Street | National City | 1959 | 3 | 2 | 1,565 | 7,500 | $518 | $810,000 | 163 | 83 |
| 1003 Manchester Street | National City | 1959 | 3 | 2 | 1,802 | 8,276 | $472 | $849,999 | 32 | 82 |
| 144 Kenyatta | San Diego | 1978 | 4 | 2 | 1,908 | 7,266 | $471 | $899,000 | 23 | 74 |
| 1270 Valencia Pkwy | San Diego | 1987 | 4 | 2 | 1,290 | 12,000 | $659 | $850,000 | 18 | 71 |
| Total: 5 · Average | 3.6 | 2.0 | 1,673 | 8,528.4 | $524 | $861,799.8 | 71.6 | |||
| Median | 1,800 | $850,000 | ||||||||
Closed Properties (5)
Closed Comparables
| Address | City | Year | Date | BD | BTH | SqFt | LotSz | LP | SP | SP/SqFt | SP/LP | DIM | Score |
|---|---|---|---|---|---|---|---|---|---|---|---|---|---|
| 2217 Alpha Street | National City | 1952 | 09/08/2026 | 6 | 3 | 1,925 | 5,000 | $849,999 | $875,000 | $455 | 1.03 | 40 | 84 |
| 1417 58Th Street | San Diego | 1963 | 08/14/2026 | 4 | 2 | 1,730 | 7,405 | $885,000 | $880,000 | $509 | 0.99 | 81 | 80 |
| 2747 Melrose | National City | — | 02/13/2026 | 3 | 2 | 1,876 | 7,000 | $839,999 | $835,000 | $445 | 0.99 | 25 | 79 |
| 5868 Greycourt Avenue | San Diego | 1968 | 12/19/2025 | 4 | 3 | 2,139 | 5,500 | $829,000 | $850,000 | $397 | 1.02 | 31 | 78 |
| 5474 Olvera Ave | San Diego | 1951 | 02/05/2026 | 3 | 2 | 1,873 | 6,900 | $889,000 | $889,000 | $475 | 1.00 | 36 | 75 |
| Total: 5 · Average | 4.0 | 2.4 | 1,908.6 | 6,361 | $865,800 | $865,800 | $456.2 | — | 42.6 | ||||
| Median | 1,876 | $875,000 | $875,000 | ||||||||||
Market Analysis
List vs Sale $/SqFt
Sale Price Trend
Days on Market
Sale vs List Price
This analysis was generated automatically from MLS data. For an in-depth, human-reviewed valuation, contact Joseph Sardella at josephsardella@gmail.com.