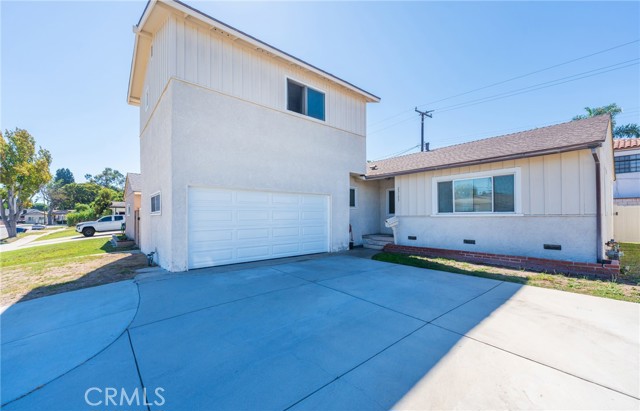
23133 Meyler, Torrance, CA 90502
23133 Meyler, Torrance, CA 90502
Property Description
Welcome to 23133 Meyler Ave, this 5-bedroom, 2-bathroom property offers approximately 1,685 sqft of living space on a 5,140 sqft lot. The home features a functional two-level layout, with 3 bedrooms and 1 bathroom downstairs and 2 bedrooms and 1 bathroom upstairs. In need of some TLC, this property presents an excellent opportunity for buyers looking to renovate, customize, and add value. With its generous bedroom count and versatile floor plan, this home has plenty of potential for someone to make it their own. Bring your vision and explore the possibilities! Located near shopping centers, restaurants, gym, freeways and so much more
Features & Amenities
Property Details
Mortgage Calculator
Current Rates
Comparative Market Analysis
Residential Tier · 5 active · 5 closed
Torrance · Single Family Residence
Listed 9.3% below the median closed sale of $910,000. Price per sqft ($490) is a 19% discount to closed comps ($608). Closed comps sold at 102% of list — strong seller's market.
Price Position
Priced below the market — value advantage over the field.
Active Properties (5)
Active Comparables
| Address | City | Year | BD | BTH | SqFt | LotSz | LP/SqFt | LP | DIM | Score |
|---|---|---|---|---|---|---|---|---|---|---|
| 22443 Meyler Street | Torrance | 1927 | 3 | 2 | 1,487 | 5,063 | $518 | $771,000 | 83 | 80 |
| 22903 Petroleum | Torrance | 1953 | 3 | 1 | 968 | 5,200 | $842 | $815,000 | 93 | 80 |
| 23327 Orchard | Carson | 1954 | 3 | 1 | 924 | 4,963 | $774 | $715,000 | 58 | 77 |
| 22620 Menlo | Torrance | 1954 | 3 | 2 | 1,267 | 3,844 | $599 | $759,000 | 40 | 76 |
| 1444 Plaza Del Amo | Torrance | 2023 | 3 | 3 | 1,519 | 1,833 | $540 | $820,000 | 15 | 74 |
| Total: 5 · Average | 3.0 | 1.8 | 1,233 | 4,180.6 | $654.6 | $776,000 | 57.8 | |||
| Median | 1,267 | $771,000 | ||||||||
Closed Properties (5)
Closed Comparables
| Address | City | Year | Date | BD | BTH | SqFt | LotSz | LP | SP | SP/SqFt | SP/LP | DIM | Score |
|---|---|---|---|---|---|---|---|---|---|---|---|---|---|
| 938 Rayland Drive | Torrance | 1960 | 08/14/2026 | 3 | 2 | 1,528 | 5,445 | $895,000 | $915,000 | $599 | 1.02 | 36 | 89 |
| 23033 Alexandria | Torrance | 1956 | 12/22/2025 | 5 | 3 | 1,738 | 7,557 | $845,000 | $855,000 | $492 | 1.01 | 75 | 86 |
| 23232 Doble | Torrance | 1960 | 06/11/2026 | 3 | 2 | 1,290 | 5,031 | $899,000 | $926,000 | $718 | 1.03 | 37 | 86 |
| 23410 Sidlee Place | Harbor City | 1969 | 08/05/2026 | 4 | 2 | 1,574 | 5,994 | $880,000 | $900,000 | $572 | 1.02 | 34 | 85 |
| 939 Belson Street | Torrance | 1953 | 04/28/2026 | 3 | 2 | 1,382 | 6,003 | $899,999 | $910,000 | $658 | 1.01 | 54 | 84 |
| Total: 5 · Average | 3.6 | 2.2 | 1,502.4 | 6,006 | $901,200 | $901,200 | $607.8 | — | 47.2 | ||||
| Median | 1,528 | $910,000 | $910,000 | ||||||||||
Market Analysis
List vs Sale $/SqFt
Sale Price Trend
Days on Market
Sale vs List Price
This analysis was generated automatically from MLS data. For an in-depth, human-reviewed valuation, contact Joseph Sardella at josephsardella@gmail.com.