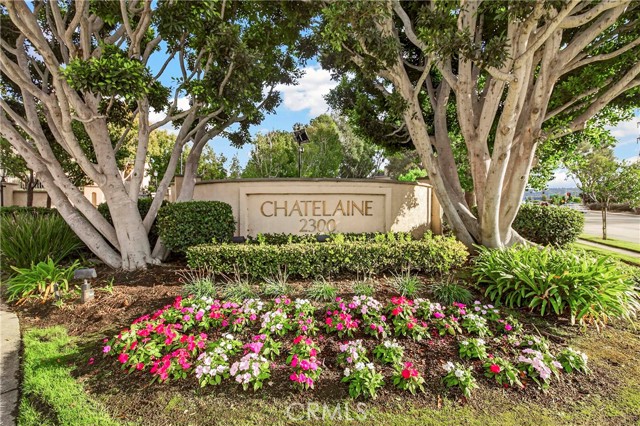
1 / 63
2300 MAPLE Avenue, 201, Torrance, CA 90503
$995K3bd · 3ba · 1,738 sqft
HOA $626/mo•Townhouse•Active•14d on market•MLS# SB-26224543
2300 MAPLE Avenue, 201, Torrance, CA 90503
MLS# SB-26224543•Residential•Townhouse
Active14 days on market
$995,000
3
Beds
3
Baths
1,738
Sq Ft
$626
HOA/mo
1987
Year Built
Property Description
Beautiful town house located in the middle of complex. Close to market, Del Amo Shopping center, Wilson Park and Redondo Beach. Refrigerator, washer and dryer included with purchase price. Mostly remodeled interior. Seller purchased another house and moved out, wants fast sale. Comfortable split level living room.
Features & Amenities
FeeBuilt 1987
Property Details
Land Type
Fee
Year Built
1987
Property Type
Residential
Property Subtype
Townhouse
Parking Spaces
2
Garage Spaces
2
Heating
Wall Furnace, Central
Cooling
Central Air
City
Torrance
Zip Code
90503
County
Los Angeles
Mortgage Calculator
Current Rates
$
$
%
Monthly Payment
$5,031.26
Principal & Interest
Loan Amount
$796,000
Total Interest
$1,015,254
Total Payment Over 30 Years
$1,811,254
This calculator provides estimates only. Actual mortgage payments may include taxes, insurance, HOA fees, and PMI. Contact a lender for accurate quotes.
Comparative Market Analysis
Residential Tier · 5 active · 5 closed
2300 MAPLE Avenue, 201, Torrance, CA 90503
Torrance · Townhouse
$995K
Residential TierBeds
3
Baths
3
Sqft
1,738
Lot
0 sqft
Year
1987
$/Sqft
$572
Pool: No✓
Garage: 2-car✓
Listed in line with the median closed sale of $967,500. Closed comps sold at 102% of list — strong seller's market.
Price Position
Aligned with the market — fair pricing for the comps.
At market
Subject listed at $995K· $572/sqft
Total list price
Closed comps
vs closed median $968K
+$28K (+2.8%)
Active comps
vs active median $929K
+$66K (+7.1%)
Price per sqft
Closed compsinsufficient comp data
Active comps
vs active avg $/sqft $555
+$17 (+3.0%)
Active Properties (5)
Active Comparables
| Address | City | Year | BD | BTH | SqFt | LotSz | LP/SqFt | LP | DIM | Score |
|---|---|---|---|---|---|---|---|---|---|---|
| 2300 Maple Avenue | Torrance | 1989 | 3 | 3 | 1,738 | 136,199 | $540 | $939,000 | 61 | 98 |
| 2300 Maple Avenue | Torrance | 1987 | 2 | 3 | 1,738 | 10,042 | $540 | $939,000 | 13 | 97 |
| 2300 Maple | Torrance | 1988 | 2 | 3 | 1,713 | 156,377 | $542 | $929,000 | 82 | 95 |
| 2751 235th Street | Torrance | 1992 | 2 | 3 | 1,683 | 2,792 | $534 | $899,000 | 32 | 88 |
| 2595 Plaza Del Amo | Torrance | 1987 | 2 | 3 | 1,429 | 103,374 | $621 | $888,000 | 51 | 88 |
| Total: 5 · Average | 2.2 | 3.0 | 1,660.2 | 81,756.8 | $555.4 | $918,800 | 47.8 | |||
| Median | 1,713 | $929,000 | ||||||||
Closed Properties (5)
Closed Comparables
| Address | City | Year | Date | BD | BTH | SqFt | LotSz | LP | SP | SP/SqFt | SP/LP | DIM | Score |
|---|---|---|---|---|---|---|---|---|---|---|---|---|---|
| 2300 Maple Avenue | Torrance | 1987 | 07/29/2026 | 3 | 3 | 1,738 | 149,046 | $965,000 | $967,500 | $557 | 1.00 | 90 | 98 |
| 2300 Maple Ave | Torrance | 1988 | 05/21/2026 | 3 | 3 | 1,713 | 156,377 | $969,000 | $1.00M | $584 | 1.03 | 28 | 97 |
| 2971 Plaza Del Amo | Torrance | 1985 | 07/31/2026 | 3 | 3 | 1,434 | 94,785 | $925,000 | $885,000 | $617 | 0.96 | 98 | 92 |
| 2825 Plaza Del Amo | Torrance | 1993 | 05/04/2026 | 3 | 3 | 1,839 | 68,360 | $1.05M | $1.10M | $598 | 1.05 | 42 | 92 |
| 2595 Plaza Del Amo | Torrance | 1986 | 09/04/2026 | 3 | 3 | 1,549 | 103,374 | $849,000 | $881,000 | $569 | 1.04 | 45 | 92 |
| Total: 5 · Average | 3.0 | 3.0 | 1,654.6 | 114,388.4 | $966,700 | $966,700 | $585 | — | 60.6 | ||||
| Median | 1,713 | $967,500 | $967,500 | ||||||||||
Market Analysis
List vs Sale $/SqFt
Sale Price Trend
Days on Market
Sale vs List Price
AI-generated CMA
This analysis was generated automatically from MLS data. For an in-depth, human-reviewed valuation, contact Joseph Sardella at josephsardella@gmail.com.