1 / 39
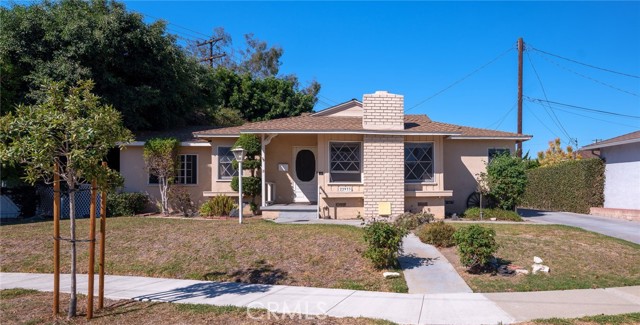
22933 Kent Avenue, Torrance, CA 90505
$1.30M3bd · 2ba · 1,509 sqft
Lot 6,804 sqft•Single Family Residence•Active•26d on market•MLS# SB-26204962
22933 Kent Avenue, Torrance, CA 90505
MLS# SB-26204962•Residential•Single Family Residence
Active26 days on market
$1,298,000
3
Beds
2
Baths
1,509
Sq Ft
6,804
Lot Sq Ft
1955
Year Built
None
View
Property Description
First time on the market! Tucked at the end of a cul-de-sac in the Arnold Elementary neighborhood, with easy access to TUSD middle & South High Schools, shopping, and of course the Beach! Featuring 3 bedrooms, 2 bathrooms, a den, living & family rooms, plus a 2-car detached garage with a long driveway on a large lot. Don’t miss your chance to make it yours!
Features & Amenities
FeeBuilt 1955
Property Details
Land Type
Fee
Year Built
1955
Property Type
Residential
Property Subtype
Single Family Residence
Parking Spaces
2
Garage Spaces
2
Cooling
None
View
None
City
Torrance
Zip Code
90505
County
Los Angeles
Mortgage Calculator
Current Rates
$
$
%
Monthly Payment
$6,563.39
Principal & Interest
Loan Amount
$1,038,400
Total Interest
$1,324,422
Total Payment Over 30 Years
$2,362,822
This calculator provides estimates only. Actual mortgage payments may include taxes, insurance, HOA fees, and PMI. Contact a lender for accurate quotes.
Comparative Market Analysis
Residential Tier · 5 active · 5 closed
22933 Kent Avenue, Torrance, CA 90505
Torrance · Single Family Residence
$1.30M
Residential TierBeds
3
Baths
2
Sqft
1,509
Lot
6,804 sqft
Year
1955
$/Sqft
$860
Pool: No✓
View: None✓
Garage: 2-car✓
Listed in line with the median closed sale of $1,330,000.
Price Position
Aligned with the market — fair pricing for the comps.
At market
Subject listed at $1.30M· $860/sqft
Total list price
Closed comps
vs closed median $1.33M
−$32K (−2.4%)
Active comps
vs active median $1.27M
+$23K (+1.8%)
Price per sqft
Closed compsinsufficient comp data
Active comps
vs active avg $/sqft $892
−$32 (−3.5%)
Active Properties (5)
Active Comparables
| Address | City | Year | BD | BTH | SqFt | LotSz | LP/SqFt | LP | DIM | Score |
|---|---|---|---|---|---|---|---|---|---|---|
| 1226 Fonthill Avenue | Torrance | 1951 | 3 | 2 | 1,386 | 5,993 | $920 | $1.27M | 4 | 83 |
| 20029 Ingrum Way | Torrance | 1955 | 3 | 2 | 1,344 | 5,388 | $967 | $1.30M | 37 | 77 |
| 2430 239th Street | Torrance | 1910 | 3 | 2 | 1,690 | 6,100 | $695 | $1.18M | 22 | 74 |
| 25710 Crest Road | Torrance | 1954 | 4 | 2 | 1,394 | 5,842 | $1,004 | $1.40M | 27 | 74 |
| 24248 Falena | Torrance | 1954 | 3 | 2 | 1,455 | 6,214 | $872 | $1.27M | 53 | 73 |
| Total: 5 · Average | 3.2 | 2.0 | 1,453.8 | 5,907.4 | $891.6 | $1.28M | 28.6 | |||
| Median | 1,394 | $1.27M | ||||||||
Closed Properties (5)
Closed Comparables
| Address | City | Year | Date | BD | BTH | SqFt | LotSz | LP | SP | SP/SqFt | SP/LP | DIM | Score |
|---|---|---|---|---|---|---|---|---|---|---|---|---|---|
| 22734 Marjorie | Torrance | 1953 | 05/01/2026 | 3 | 2 | 1,496 | 5,328 | $1.36M | $1.32M | $882 | 0.97 | 30 | 93 |
| 23501 Ladeene Avenue | Torrance | 1962 | 09/08/2026 | 3 | 2 | 1,473 | 6,214 | $1.35M | $1.33M | $903 | 0.99 | 95 | 93 |
| 22933 Galva Avenue | Torrance | 1955 | 11/13/2025 | 3 | 2 | 1,498 | 4,928 | $1.38M | $1.33M | $891 | 0.97 | 140 | 91 |
| 23320 Anza | Torrance | 1961 | 08/05/2026 | 4 | 2 | 1,678 | 6,424 | $1.20M | $1.20M | $715 | 1.00 | 21 | 90 |
| 22928 Evalyn | Torrance | 1954 | 01/08/2026 | 3 | 2 | 1,365 | 5,131 | $1.39M | $1.44M | $1,051 | 1.03 | 35 | 88 |
| Total: 5 · Average | 3.2 | 2.0 | 1,502 | 5,605 | $1.32M | $1.32M | $888.4 | — | 64.2 | ||||
| Median | 1,496 | $1.33M | $1.33M | ||||||||||
Market Analysis
List vs Sale $/SqFt
Sale Price Trend
Days on Market
Sale vs List Price
AI-generated CMA
This analysis was generated automatically from MLS data. For an in-depth, human-reviewed valuation, contact Joseph Sardella at josephsardella@gmail.com.