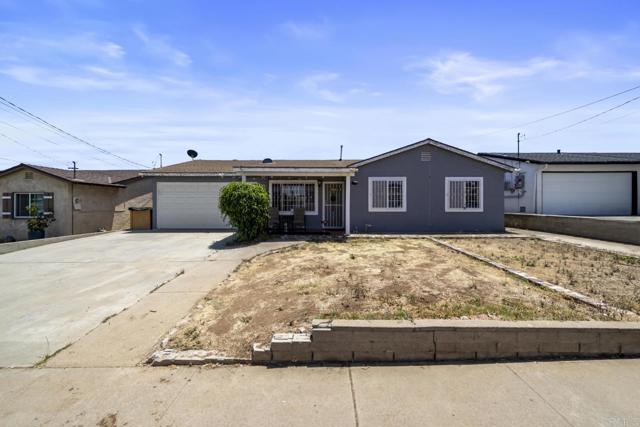
2255 Ingrid Avenue, San Diego, CA 92154
2255 Ingrid Avenue, San Diego, CA 92154
Property Description
Welcome home! Nestled in a family-friendly community, this beautiful 3-bedroom, 2-bathroom property perfectly blends comfort and coastal living. Enjoy the convenience of living just minutes from local beaches, schools, everyday shopping, and dining. Commuting is an absolute breeze with quick, easy access to the freeway.
Features & Amenities
Property Details
Mortgage Calculator
Current Rates
Comparative Market Analysis
Residential Tier · 5 active · 5 closed
San Diego · Single Family Residence
Listed in line with the median closed sale of $790,000. Price per sqft ($448) is a 18% discount to closed comps ($544). Closed comps sold at 103% of list — strong seller's market.
Price Position
Aligned with the market — fair pricing for the comps.
Active Properties (5)
Active Comparables
| Address | City | Year | BD | BTH | SqFt | LotSz | LP/SqFt | LP | DIM | Score |
|---|---|---|---|---|---|---|---|---|---|---|
| 2224 Hemlock Avenue | San Diego | 1958 | 3 | 2 | 1,200 | 6,000 | $582 | $699,000 | 12 | 92 |
| 1655 Arequipa Street | San Diego | 1972 | 3 | 2 | 1,481 | 6,100 | $573 | $849,000 | 25 | 86 |
| 1780 Simpatico Court | San Diego | 1985 | 3 | 2 | 1,620 | 4,892 | $494 | $800,000 | 8 | 86 |
| 930 Harwood Street | San Diego | 1958 | 4 | 3 | 2,033 | 6,700 | $378 | $769,000 | 2 | 82 |
| 1035 Hawaii Avenue | San Diego | 1971 | 3 | 2 | 1,373 | 5,227 | $589 | $809,000 | 10 | 82 |
| Total: 5 · Average | 3.2 | 2.2 | 1,541.4 | 5,783.8 | $523.2 | $785,200 | 11.4 | |||
| Median | 1,481 | $800,000 | ||||||||
Closed Properties (5)
Closed Comparables
| Address | City | Year | Date | BD | BTH | SqFt | LotSz | LP | SP | SP/SqFt | SP/LP | DIM | Score |
|---|---|---|---|---|---|---|---|---|---|---|---|---|---|
| 1133 27th Street | San Diego | 1966 | 06/18/2026 | 3 | 2 | 1,698 | 6,000 | $755,000 | $765,000 | $451 | 1.01 | 104 | 91 |
| 1441 Green Bay Street | San Diego | 1958 | 02/13/2026 | 3 | 2 | 1,200 | 6,000 | $749,999 | $800,000 | $667 | 1.07 | 28 | 86 |
| 2851 Dahlia Avenue | San Diego | 1970 | 10/26/2026 | 3 | 2 | 1,342 | 6,500 | $790,000 | $790,000 | $589 | 1.00 | 39 | 85 |
| 1865 Wolviston Way | San Diego | 1970 | 07/15/2026 | 4 | 2 | 2,130 | 6,300 | $830,000 | $830,000 | $390 | 1.00 | 39 | 84 |
| 1216 Zurich | San Diego | 1979 | 09/14/2026 | 3 | 2 | 1,160 | 4,996 | $679,900 | $720,000 | $621 | 1.06 | 59 | 84 |
| Total: 5 · Average | 3.2 | 2.0 | 1,506 | 5,959.2 | $781,000 | $781,000 | $543.6 | — | 53.8 | ||||
| Median | 1,342 | $790,000 | $790,000 | ||||||||||
Market Analysis
List vs Sale $/SqFt
Sale Price Trend
Days on Market
Sale vs List Price
This analysis was generated automatically from MLS data. For an in-depth, human-reviewed valuation, contact Joseph Sardella at josephsardella@gmail.com.