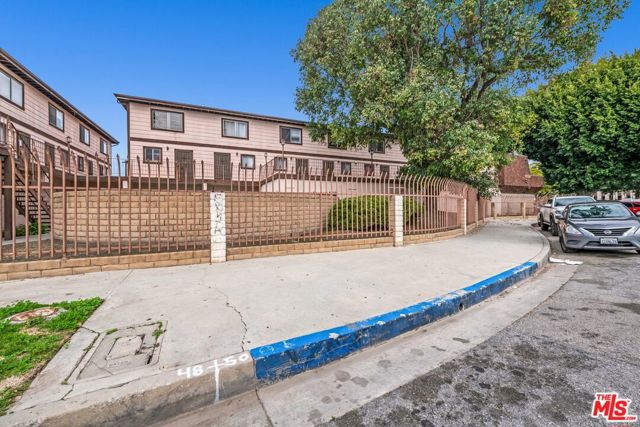
223 South Acacia Avenue, 205, Compton, CA 90220
223 South Acacia Avenue, 205, Compton, CA 90220
Property Description
This home qualifies for a $20,000 grant that can be used for the down payment, closing costs, or to buy down the interest rate. Additionally, there is no PMI (Private Mortgage Insurance) required, with a minimum down payment of just 3%! Beautifully updated two-story townhome-style condo featuring modern finishes and stylish upgrades throughout! The main level showcases durable LVP flooring, complemented by additional LVP in select upstairs areas. The spacious kitchen offers updated countertops, refreshed cabinetry, and tile flooring, creating the perfect blend of style and functionality. The primary bathroom has been tastefully renovated with a tiled shower and updated vanity/sink. Enjoy an open and inviting layout with plenty of natural light, spacious bedrooms, and versatile living spaces perfect for entertaining or everyday living. Conveniently located near shopping, dining, parks, and major highways, this move-in-ready home is a must-see!
Features & Amenities
Property Details
Mortgage Calculator
Current Rates
Comparative Market Analysis
Affordable Tier · 0 active · 3 closed
Compton · Condominium
Listed 6.9% below the median closed sale of $375,000. Price per sqft ($315) is a 26% discount to closed comps ($424). Closed comps sold at 101% of list — strong seller's market.
Price Position
Priced below the market — value advantage over the field.
Closed Properties (3)
Closed Comparables
| Address | City | Year | Date | BD | BTH | SqFt | LotSz | LP | SP | SP/SqFt | SP/LP | DIM | Score |
|---|---|---|---|---|---|---|---|---|---|---|---|---|---|
| 223 Acacia Avenue | Compton | 1981 | 09/24/2026 | 2 | 3 | 1,109 | 18,607 | $339,500 | $346,000 | $312 | 1.02 | 187 | 97 |
| 707 4th | Long Beach | 1988 | 09/04/2026 | 1 | 1 | 640 | 16,130 | $399,000 | $399,000 | $623 | 1.00 | 45 | 70 |
| 849 Victoria | Carson | 1981 | 07/01/2026 | 2 | 2 | 1,115 | 169,394 | $375,000 | $375,000 | $336 | 1.00 | 81 | 65 |
| Total: 3 · Average | 1.7 | 2.0 | 954.667 | 68,043.667 | $373,333.333 | $373,333.333 | $423.667 | — | 104.33333333333333 | ||||
| Median | 1,109 | $375,000 | $375,000 | ||||||||||
Market Analysis
List vs Sale $/SqFt
Sale Price Trend
Days on Market
Sale vs List Price
This analysis was generated automatically from MLS data. For an in-depth, human-reviewed valuation, contact Joseph Sardella at josephsardella@gmail.com.