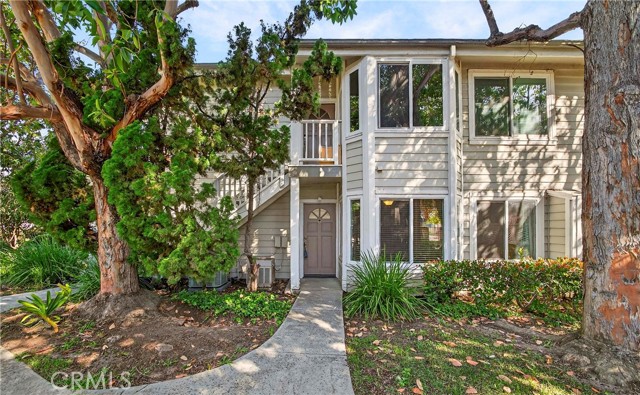
22224 South Vermont Avenue, 102C, Torrance, CA 90502
22224 South Vermont Avenue, 102C, Torrance, CA 90502
Property Description
Lower level 2 bedroom, 2 bathroom condo located in a gated community in Torrance P.O. This unit features a functional floor plan with a spacious living room, gas fireplace, and sliding glass doors leading to a private patio. The dining area connects to the kitchen, offering a practical layout for everyday living. The primary bedroom includes an ensuite bathroom and ample closet space. The second bedroom and additional full bath provide flexibility for various uses. Additional features include central air and heat and two covered carport spaces. Community amenities available; buyer to verify HOA details and financing options. Conveniently located near shopping, dining, and freeway access.
Features & Amenities
Property Details
Mortgage Calculator
Current Rates
Comparative Market Analysis
Affordable Tier · 5 active · 5 closed
Torrance · Condominium
Listed in line with the median closed sale of $550,000. Closed comps sold at 106% of list — strong seller's market.
Price Position
Aligned with the market — fair pricing for the comps.
Active Properties (5)
Active Comparables
| Address | City | Year | BD | BTH | SqFt | LotSz | LP/SqFt | LP | DIM | Score |
|---|---|---|---|---|---|---|---|---|---|---|
| 22224 Vermont Avenue | Torrance | 1985 | 2 | 2 | 1,120 | 181,676 | $500 | $559,990 | 59 | 99 |
| 22232 Vermont Avenue | Torrance | 1985 | 3 | 2 | 1,219 | 181,676 | $463 | $565,000 | 68 | 94 |
| 22232 Vermont Avenue | Torrance | 1985 | 3 | 2 | 1,219 | 181,676 | $450 | $549,000 | 9 | 93 |
| 22232 Vermont Avenue | Torrance | 1985 | 2 | 2 | 961 | 181,676 | $519 | $499,000 | 94 | 92 |
| 946 220th Street | Torrance | 1981 | 3 | 2 | 1,332 | 77,750 | $450 | $599,000 | 16 | 84 |
| Total: 5 · Average | 2.6 | 2.0 | 1,170.2 | 160,890.8 | $476.4 | $554,398 | 49.2 | |||
| Median | 1,219 | $559,990 | ||||||||
Closed Properties (5)
Closed Comparables
| Address | City | Year | Date | BD | BTH | SqFt | LotSz | LP | SP | SP/SqFt | SP/LP | DIM | Score |
|---|---|---|---|---|---|---|---|---|---|---|---|---|---|
| 22238 Vermont Ave 102 D | Torrance | 1985 | 08/24/2026 | 3 | 2 | 1,219 | 181,676 | $605,000 | $605,000 | $496 | 1.00 | 54 | 91 |
| 23310 Marigold | Torrance | 1973 | 09/18/2026 | 3 | 2 | 1,066 | 209,813 | $539,000 | $556,000 | $522 | 1.03 | 101 | 85 |
| 516 219th Street | Carson | 1989 | 08/27/2026 | 2 | 3 | 1,194 | 101,455 | $400,000 | $525,000 | $440 | 1.31 | 34 | 84 |
| 21854 Vermont Avenue | Torrance | 1994 | 05/01/2026 | 3 | 2 | 1,071 | 40,003 | $589,000 | $550,000 | $514 | 0.93 | 113 | 81 |
| 23230 Sesame | Torrance | 1973 | 11/17/2025 | 2 | 2 | 842 | 309,276 | $475,000 | $485,000 | $576 | 1.02 | 53 | 75 |
| Total: 5 · Average | 2.6 | 2.2 | 1,078.4 | 168,444.6 | $544,200 | $544,200 | $509.6 | — | 71 | ||||
| Median | 1,071 | $550,000 | $550,000 | ||||||||||
Market Analysis
List vs Sale $/SqFt
Sale Price Trend
Days on Market
Sale vs List Price
This analysis was generated automatically from MLS data. For an in-depth, human-reviewed valuation, contact Joseph Sardella at josephsardella@gmail.com.