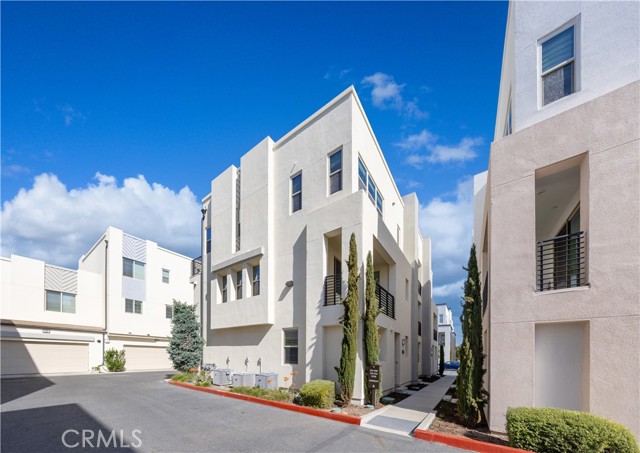
1 / 30
222 Harringay, Irvine, CA 92618
$1.14M3bd · 4ba · 2,017 sqft
Lot 225,106 sqft•HOA $240/mo•Condominium•Active•109d on market•MLS# OC-26155387
222 Harringay, Irvine, CA 92618
MLS# OC-26155387•Residential•Condominium
Active109 days on market
$1,138,000
3
Beds
4
Baths
2,017
Sq Ft
225,106
Lot Sq Ft
$240
HOA/mo
2018
Year Built
Mountain(s)
View
Features & Amenities
FeeBuilt 2018
Property Details
Land Type
Fee
Year Built
2018
Property Type
Residential
Property Subtype
Condominium
Parking Spaces
2
Garage Spaces
2
Cooling
Central Air
View
Mountain(s)
City
Irvine
Zip Code
92618
County
Orange
Mortgage Calculator
Current Rates
$
$
%
Monthly Payment
$5,754.35
Principal & Interest
Loan Amount
$910,400
Total Interest
$1,161,165
Total Payment Over 30 Years
$2,071,565
This calculator provides estimates only. Actual mortgage payments may include taxes, insurance, HOA fees, and PMI. Contact a lender for accurate quotes.
Comparative Market Analysis
Residential Tier · 5 active · 5 closed
222 Harringay, Irvine, CA 92618
Irvine · Condominium
$1.14M
Residential TierBeds
3
Baths
4
Sqft
2,017
Lot
5.17 ac
Year
2018
$/Sqft
$564
Pool: No✓
View: mountain✓
Garage: 2-car✓
Listed 3.5% above the median closed sale of $1,100,000.
Price Position
Aligned with the market — fair pricing for the comps.
At market
Subject listed at $1.14M· $564/sqft
Total list price
Closed comps
vs closed median $1.10M
+$38K (+3.5%)
Active comps
vs active median $1.25M
−$112K (−9.0%)
Price per sqft
Closed compsinsufficient comp data
Active comps
vs active avg $/sqft $608
−$44 (−7.2%)
Active Properties (5)
Active Comparables
| Address | City | Year | BD | BTH | SqFt | LotSz | LP/SqFt | LP | DIM | Score |
|---|---|---|---|---|---|---|---|---|---|---|
| 107 Cadence | Irvine | 2018 | 3 | 3 | 2,032 | 225,106 | $566 | $1.15M | 2 | 92 |
| 129 Terrapin | Irvine | 2017 | 3 | 4 | 1,944 | 0 | $668 | $1.30M | 16 | 90 |
| 151 Cadence | Irvine | 2017 | 2 | 3 | 1,756 | 240,138 | $592 | $1.04M | 19 | 86 |
| 745 Beacon | Irvine | 2018 | 3 | 4 | 2,260 | 195,757 | $575 | $1.30M | 127 | 85 |
| 251 Follyhatch | Irvine | 2016 | 3 | 3 | 1,963 | 153,285 | $637 | $1.25M | 73 | 82 |
| Total: 5 · Average | 2.8 | 3.4 | 1,991 | 203,571.5 | $607.6 | $1.21M | 47.4 | |||
| Median | 1,963 | $1.25M | ||||||||
Closed Properties (5)
Closed Comparables
| Address | City | Year | Date | BD | BTH | SqFt | LotSz | LP | SP | SP/SqFt | SP/LP | DIM | Score |
|---|---|---|---|---|---|---|---|---|---|---|---|---|---|
| 123 Cadence | Irvine | 2018 | 09/14/2026 | 3 | 4 | 2,036 | 225,106 | $1.10M | $1.08M | $530 | 0.98 | 75 | 93 |
| 136 Acamar | Irvine | 2016 | 08/19/2026 | 3 | 4 | 1,939 | 135,928 | $1.15M | $1.10M | $567 | 0.96 | 118 | 92 |
| 108 Cadence | Irvine | 2018 | 10/13/2026 | 2 | 3 | 1,383 | 240,138 | $998,000 | $980,000 | $709 | 0.98 | 33 | 88 |
| 153 Fixie | Irvine | 2017 | 09/28/2026 | 3 | 4 | 2,134 | 0 | $1.29M | $1.24M | $581 | 0.96 | 101 | 88 |
| 126 Novel | Irvine | 2019 | 11/20/2025 | 3 | 4 | 1,960 | 0 | $1.25M | $1.23M | $628 | 0.98 | 72 | 86 |
| Total: 5 · Average | 2.8 | 3.8 | 1,890.4 | 200,390.667 | $1.13M | $1.13M | $603 | — | 79.8 | ||||
| Median | 1,960 | $1.10M | $1.10M | ||||||||||
Market Analysis
List vs Sale $/SqFt
Sale Price Trend
Days on Market
Sale vs List Price
AI-generated CMA
This analysis was generated automatically from MLS data. For an in-depth, human-reviewed valuation, contact Joseph Sardella at josephsardella@gmail.com.