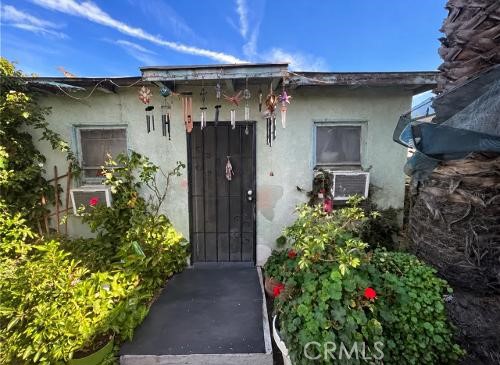
22110 Elaine, Hawaiian Gardens, CA 90716
22110 Elaine, Hawaiian Gardens, CA 90716
Property Description
*** Investor opportunity in the City of Hawaiian Gardens *** This 3 Bedroom 1 Bath home is a major fixer with great potential and ready for all your renovation ideas, a great chance to customize and add value. Sold AS-IS, Seller will make no repairs. Buyer to verify square footage and bedroom count. Bring your vision and transform this property. **Conveniently located close to freeways and shopping centers**
Features & Amenities
Property Details
Mortgage Calculator
Current Rates
Comparative Market Analysis
Affordable Tier · 1 active · 5 closed
Hawaiian Gardens · Single Family Residence
Listed in line with the median closed sale of $451,000. Price per sqft ($658) is a 84% premium to closed comps ($358). Closed comps sold at 100% of list — strong seller's market.
Price Position
Aligned with the market — fair pricing for the comps.
Active Properties (1)
Active Comparables
| Address | City | Year | BD | BTH | SqFt | LotSz | LP/SqFt | LP | DIM | Score |
|---|---|---|---|---|---|---|---|---|---|---|
| 12750 Centralia | Lakewood | 1978 | 1 | 1 | 844 | 1,117 | $533 | $449,900 | 107 | 67 |
| Total: 1 · Average | 1.0 | 1.0 | 844 | 1,117 | $533 | $449,900 | 107 | |||
| Median | 844 | $449,900 | ||||||||
Closed Properties (5)
Closed Comparables
| Address | City | Year | Date | BD | BTH | SqFt | LotSz | LP | SP | SP/SqFt | SP/LP | DIM | Score |
|---|---|---|---|---|---|---|---|---|---|---|---|---|---|
| 12750 Centralia | Lakewood | 1978 | 08/10/2026 | 1 | 1 | 844 | 1,117 | $449,000 | $451,000 | $534 | 1.00 | 32 | 70 |
| 4517 Acacia | San Bernardino | 1947 | 07/28/2026 | 2 | 1 | 828 | 8,400 | $434,900 | $450,000 | $543 | 1.03 | 74 | 63 |
| 16219 Manzanita | Hesperia | 1987 | 07/09/2026 | 3 | 2 | 1,380 | 45,302 | $424,900 | $424,900 | $308 | 1.00 | 63 | 35 |
| 1809 Serena | Fresno | 1992 | 06/12/2026 | 3 | 2 | 1,719 | 6,448 | $499,900 | $485,000 | $282 | 0.97 | 35 | 35 |
| 2708 Grey Fox Dr. Drive | Weed | 1984 | 06/30/2026 | 5 | 4 | 3,885 | 435,600 | $485,000 | $485,000 | $125 | 1.00 | 40 | 24 |
| Total: 5 · Average | 2.8 | 2.0 | 1,731.2 | 99,373.4 | $459,180 | $459,180 | $358.4 | — | 48.8 | ||||
| Median | 1,380 | $451,000 | $451,000 | ||||||||||
Market Analysis
List vs Sale $/SqFt
Sale Price Trend
Days on Market
Sale vs List Price
This analysis was generated automatically from MLS data. For an in-depth, human-reviewed valuation, contact Joseph Sardella at josephsardella@gmail.com.