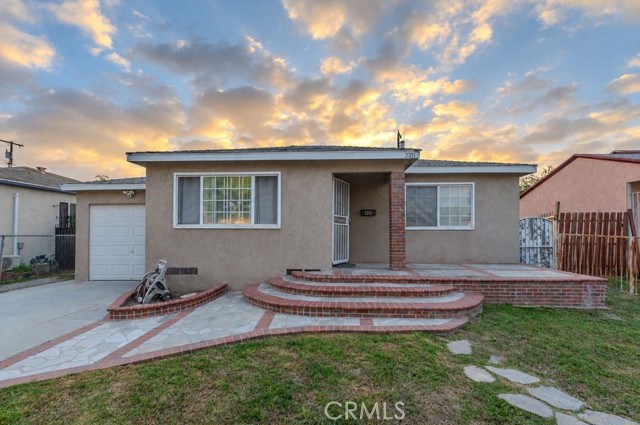
2211 North Grape Ave, Compton, CA 90222
2211 North Grape Ave, Compton, CA 90222
Property Description
Welcome to this beautiful move in ready single family residence with great curb appeal in the city of Compton. This 2,018 sf charming home features 4 bedrooms and 3 bathrooms. The spacious master bedroom has it's own bathroom and private entrance. The out door space has an ample clean yard perfect for outdoor dining, weekend BBQs, entertaining, hosting your next family event, or even a garden. Conveniently located near the 105 Freeway, shopping centers, MLK Hospital, schools, and everyday neighborhood amenities.
Features & Amenities
Property Details
Mortgage Calculator
Current Rates
Comparative Market Analysis
Residential Tier · 5 active · 5 closed
Compton · Single Family Residence
Listed 6.6% above the median closed sale of $650,000. Price per sqft ($343) is a 23% discount to closed comps ($448). Closed comps sold at 102% of list — strong seller's market.
Price Position
Positioned above the market — commands a premium.
Active Properties (5)
Active Comparables
| Address | City | Year | BD | BTH | SqFt | LotSz | LP/SqFt | LP | DIM | Score |
|---|---|---|---|---|---|---|---|---|---|---|
| 1701 Paulsen | Compton | 1950 | 4 | 2 | 1,559 | 5,103 | $394 | $615,000 | 62 | 85 |
| 2207 Anzac Avenue | Compton | 1947 | 3 | 3 | 1,722 | 5,000 | $377 | $650,000 | 631 | 82 |
| 2055 Nord | Compton | 1964 | 3 | 2 | 1,298 | 4,942 | $531 | $689,000 | 29 | 80 |
| 1001 133rd | Compton | 1950 | 3 | 2 | 1,345 | 5,833 | $461 | $620,000 | 79 | 80 |
| 815 134th | Compton | 1953 | 3 | 2 | 1,199 | 5,799 | $496 | $595,000 | 33 | 79 |
| Total: 5 · Average | 3.2 | 2.2 | 1,424.6 | 5,335.4 | $451.8 | $633,800 | 166.8 | |||
| Median | 1,345 | $620,000 | ||||||||
Closed Properties (5)
Closed Comparables
| Address | City | Year | Date | BD | BTH | SqFt | LotSz | LP | SP | SP/SqFt | SP/LP | DIM | Score |
|---|---|---|---|---|---|---|---|---|---|---|---|---|---|
| 850 132nd | Compton | 1948 | 07/31/2026 | 3 | 3 | 1,458 | 4,545 | $655,000 | $650,000 | $446 | 0.99 | 160 | 84 |
| 815 134th Place | Compton | 1927 | 06/01/2026 | 5 | 3 | 1,900 | 5,805 | $779,000 | $785,000 | $413 | 1.01 | 52 | 84 |
| 720 137th | Compton | 1950 | 07/07/2026 | 3 | 2 | 1,559 | 5,003 | $730,000 | $775,000 | $497 | 1.06 | 130 | 82 |
| 901 134th Place | Compton | 1950 | 10/21/2026 | 3 | 2 | 1,332 | 5,802 | $624,900 | $644,900 | $484 | 1.03 | 54 | 81 |
| 2107 Stockwell Street | Compton | 2012 | 05/15/2026 | 4 | 3 | 1,520 | 2,216 | $599,000 | $607,000 | $399 | 1.01 | 142 | 76 |
| Total: 5 · Average | 3.6 | 2.6 | 1,553.8 | 4,674.2 | $692,380 | $692,380 | $447.8 | — | 107.6 | ||||
| Median | 1,520 | $650,000 | $650,000 | ||||||||||
Market Analysis
List vs Sale $/SqFt
Sale Price Trend
Days on Market
Sale vs List Price
This analysis was generated automatically from MLS data. For an in-depth, human-reviewed valuation, contact Joseph Sardella at josephsardella@gmail.com.