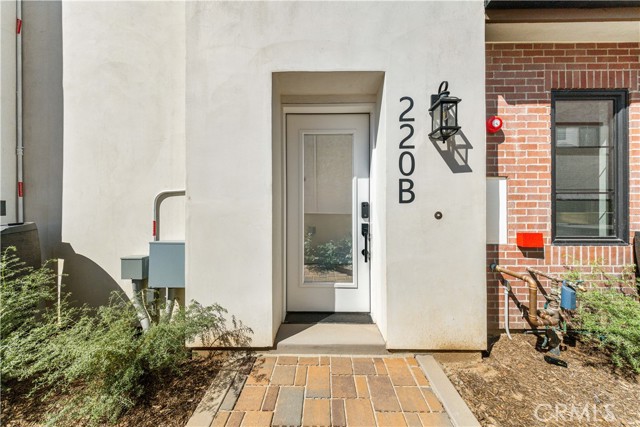
220 West Mission, B, San Gabriel, CA 91776
220 West Mission, B, San Gabriel, CA 91776
Property Description
Brand New townhouse completed in late July 2026. Unit B, only share one common wall with Unit C. This modern contemporary architecture design approx. 1972 sq ft thoughtfully integrated with energy efficient all electric new property in San Gabriel. This three-story home features 3 spacious bedrooms and 3 full bathrooms with 2 primary suites on the third floor. The modern living with numerous premium upgrades, custom cabinetry, quartz kitchen counter tops, bathrooms with imported Spanish tiles, seamless glass shower doors adding a touch of sophistication and luxury to every space, all electrical appliances, electric water heater, high performance dual-pane aluminum windows and doors, split unit HVAC systems, with EV ready inside attached garage. all floors are with 24'x48' porcelain tiles feathers uV and Stain-resistand, low-maintenance finished designed for enduring usage. Solar panels for buyer to acquire at escrow. Top patio has the beautiful view of City of San Gabriel and S.G. Mountains.
Features & Amenities
Property Details
Mortgage Calculator
Current Rates
Comparative Market Analysis
Residential Tier · 5 active · 5 closed
San Gabriel · Townhouse
Listed 5.1% above the median closed sale of $1,188,800. Price per sqft ($634) is a 16% premium to closed comps ($545).
Price Position
Positioned above the market — commands a premium.
Active Properties (5)
Active Comparables
| Address | City | Year | BD | BTH | SqFt | LotSz | LP/SqFt | LP | DIM | Score |
|---|---|---|---|---|---|---|---|---|---|---|
| 220 Mission | San Gabriel | 2026 | 3 | 3 | 1,972 | 7,576 | $659 | $1.30M | 18 | 100 |
| 220 Mission | San Gabriel | 2026 | 3 | 4 | 2,054 | 7,576 | $681 | $1.40M | 18 | 97 |
| 8615 Mission Villa dr | Rosemead | 2024 | 3 | 3 | 1,915 | 2,508 | $585 | $1.12M | 129 | 79 |
| 1500 Palm Avenue | San Gabriel | 2013 | 3 | 3 | 2,119 | 21,340 | $514 | $1.09M | 72 | 76 |
| 468 Alhambra Avenue | Monterey Park | 2007 | 4 | 3 | 2,142 | 61,326 | $555 | $1.19M | 51 | 57 |
| Total: 5 · Average | 3.2 | 3.2 | 2,040.4 | 20,065.2 | $598.8 | $1.22M | 57.6 | |||
| Median | 2,054 | $1.19M | ||||||||
Closed Properties (5)
Closed Comparables
| Address | City | Year | Date | BD | BTH | SqFt | LotSz | LP | SP | SP/SqFt | SP/LP | DIM | Score |
|---|---|---|---|---|---|---|---|---|---|---|---|---|---|
| 8739 Sienna Lane | San Gabriel | 2020 | 12/23/2025 | 4 | 3 | 2,196 | 0 | $1.17M | $1.16M | $528 | 1.00 | 82 | 74 |
| 15 Chapel Avenue | Alhambra | 2024 | 08/13/2026 | 4 | 4 | 1,981 | 19,296 | $1.29M | $1.14M | $573 | 0.88 | 94 | 73 |
| 1313 Palm Avenue | San Gabriel | 2021 | 08/07/2026 | 4 | 3 | 2,090 | 17,410 | $1.26M | $1.21M | $580 | 0.96 | 57 | 60 |
| 8939 Emperor Avenue | San Gabriel | 2008 | 02/02/2026 | 4 | 3 | 2,263 | 22,174 | $1.20M | $1.19M | $525 | 0.99 | 137 | 57 |
| 4437 Ellis Lane | Temple City | 2015 | 07/28/2026 | 4 | 3 | 2,379 | 19,552 | $1.25M | $1.24M | $521 | 0.99 | 72 | 56 |
| Total: 5 · Average | 4.0 | 3.2 | 2,181.8 | 19,608 | $1.19M | $1.19M | $545.4 | — | 88.4 | ||||
| Median | 2,196 | $1.19M | $1.19M | ||||||||||
Market Analysis
List vs Sale $/SqFt
Sale Price Trend
Days on Market
Sale vs List Price
This analysis was generated automatically from MLS data. For an in-depth, human-reviewed valuation, contact Joseph Sardella at josephsardella@gmail.com.