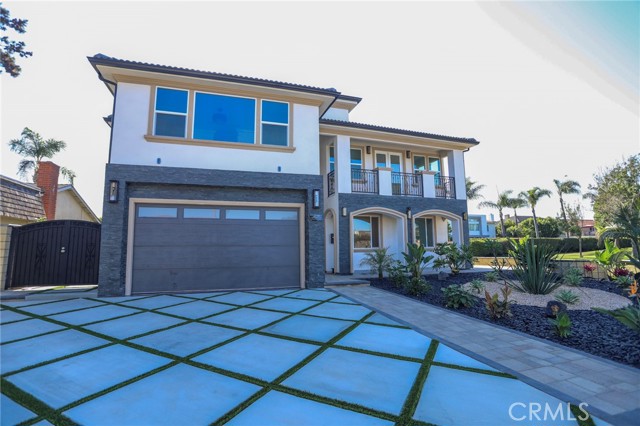
21861 Vacation Ln Lane, Huntington Beach, CA 92646
21861 Vacation Ln Lane, Huntington Beach, CA 92646
Property Description
Experience coastal living at its finest in this stunning 6-bedroom, 6,5 bathroom home located just steps from a local park and within walking distance to the beach in one of Huntington Beach’s most desirable neighborhoods. With approximately 4,400 sq ft of living space on a 6,500 sq ft corner lot, this beautifully updated two-story residence offers an open floor plan, park and greenbelt views, a cozy living room fireplace, and an attached 2-car garage—all with no HOA fees. This is a rare opportunity to own a spacious, luxury home near the coast. MAJOR REHAP WAS COMPLETED IN 09/2024
Features & Amenities
Property Details
Mortgage Calculator
Current Rates
Comparative Market Analysis
Luxury Tier · 5 active · 5 closed
Other · Huntington Beach · Single Family Residence
Listed in line with the median closed sale of $4,050,000. Price per sqft ($947) is a 28% discount to closed comps ($1,314). Closed comps sold at 92% of list — buyers have negotiating leverage. Luxury tier — fewer comparable sales widen the confidence range.
Price Position
Aligned with the market — fair pricing for the comps.
Active Properties (5)
Active Comparables
| Address | City | Year | BD | BTH | SqFt | LotSz | LP/SqFt | LP | DIM | Score |
|---|---|---|---|---|---|---|---|---|---|---|
| 2209 Cliff Drive | Newport Beach | 1971 | 4 | 6 | 4,509 | 7,405 | $832 | $3.75M | 105 | 66 |
| 203 Indianapolis Avenue | Huntington Beach | 2025 | 3 | 5 | 3,760 | 3,825 | $904 | $3.40M | 96 | 60 |
| 1022 Huntington | Huntington Beach | 2017 | 4 | 4 | 3,277 | 3,443 | $1,076 | $3.52M | 9 | 58 |
| 328 3rd Street | Huntington Beach | 2026 | 3 | 4 | 2,826 | 2,875 | $1,308 | $3.69M | 82 | 53 |
| 920 11th | Huntington Beach | 1978 | 5 | 5 | 3,936 | 8,772 | $1,091 | $4.29M | 117 | 52 |
| Total: 5 · Average | 3.8 | 4.8 | 3,661.6 | 5,264 | $1,042.2 | $3.73M | 81.8 | |||
| Median | 3,760 | $3.69M | ||||||||
Closed Properties (5)
Closed Comparables
| Address | City | Year | Date | BD | BTH | SqFt | LotSz | LP | SP | SP/SqFt | SP/LP | DIM | Score |
|---|---|---|---|---|---|---|---|---|---|---|---|---|---|
| 1795 Tanager Drive | Costa Mesa | 1972 | 07/20/2026 | 5 | 5 | 3,803 | 6,500 | $3.50M | $3.50M | $919 | 1.00 | 34 | 61 |
| 302 3rd | Huntington Beach | 2023 | 05/29/2026 | 4 | 6 | 3,747 | 2,936 | $4.50M | $4.32M | $1,152 | 0.96 | 93 | 61 |
| 175 Costa Mesa | Costa Mesa | 2019 | 07/01/2026 | 5 | 6 | 4,156 | 6,414 | $4.50M | $4.00M | $962 | 0.89 | 102 | 60 |
| 2700 Cliff | Newport Beach | 1941 | 09/04/2026 | 2 | 2 | 2,369 | 6,875 | $5.00M | $4.05M | $1,710 | 0.81 | 77 | 58 |
| 5512 Seashore | Newport Beach | 2016 | 09/15/2026 | 3 | 3 | 2,326 | 2,300 | $4.50M | $4.25M | $1,827 | 0.94 | 239 | 57 |
| Total: 5 · Average | 3.8 | 4.4 | 3,280.2 | 5,005 | $4.02M | $4.02M | $1,314 | — | 109 | ||||
| Median | 3,747 | $4.05M | $4.05M | ||||||||||
Market Analysis
List vs Sale $/SqFt
Sale Price Trend
Days on Market
Sale vs List Price
This analysis was generated automatically from MLS data. For an in-depth, human-reviewed valuation, contact Joseph Sardella at josephsardella@gmail.com.