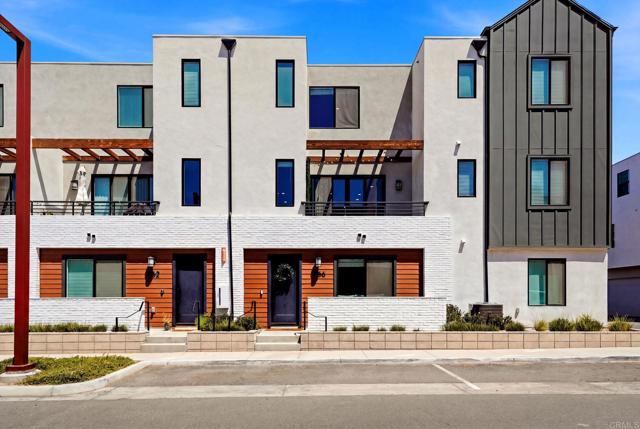
2166 Reed Drive, San Diego, CA 92154
2166 Reed Drive, San Diego, CA 92154
Property Description
Welcome to this beautiful 3-story townhome at 2166 Reed Drive in San Diego's Otay Mesa area! This 3-bedroom, 3-bathroom home offers 1,592 square feet of modern living space with a 1-car attached garage, leased Solar panels, and in unit laundry. Featuring contemporary finishes throughout and an open-concept layout, recently built in 2024 this home offers the benefits of near-new construction without the wait. The community's future pool amenity is currently under construction, adding even more value for residents to look forward to. Conveniently located near shopping, dining, and easy freeway access, this is a great opportunity to own a low-mileage home in a growing community. Don't miss your chance to make this beautiful townhome yours!
Features & Amenities
Property Details
Mortgage Calculator
Current Rates
Comparative Market Analysis
Residential Tier · 5 active · 5 closed
San Diego · Condominium
Listed in line with the median closed sale of $656,000. Closed comps sold at 103% of list — strong seller's market.
Price Position
Aligned with the market — fair pricing for the comps.
Active Properties (5)
Active Comparables
| Address | City | Year | BD | BTH | SqFt | LotSz | LP/SqFt | LP | DIM | Score |
|---|---|---|---|---|---|---|---|---|---|---|
| 2416 Cascalote Loop | San Diego | 2023 | 3 | 3 | 1,592 | 0 | $421 | $670,000 | 88 | 98 |
| 2041 Vela Lane | San Diego | 2024 | 3 | 3 | 1,385 | 0 | $432 | $599,000 | 62 | 95 |
| 6871 Secano Street | San Diego | 2023 | 4 | 4 | 1,767 | 0 | $390 | $689,999 | 53 | 92 |
| 2002 Vela Ln | San Diego | 2023 | 3 | 3 | 1,167 | 0 | $501 | $585,000 | 94 | 91 |
| 2402 Cascalote Loop | San Diego | 2023 | 4 | 4 | 1,767 | 252,363 | $396 | $699,000 | 92 | 91 |
| Total: 5 · Average | 3.4 | 3.4 | 1,535.6 | 252,363 | $428 | $648,599.8 | 77.8 | |||
| Median | 1,592 | $670,000 | ||||||||
Closed Properties (5)
Closed Comparables
| Address | City | Year | Date | BD | BTH | SqFt | LotSz | LP | SP | SP/SqFt | SP/LP | DIM | Score |
|---|---|---|---|---|---|---|---|---|---|---|---|---|---|
| 2325 Acara Circle | San Diego | 2024 | 08/25/2026 | 3 | 3 | 1,592 | 6 | $640,000 | $640,000 | $402 | 1.00 | 62 | 97 |
| 2101 Acara Circle | San Diego | 2023 | 04/30/2026 | 4 | 4 | 1,767 | 252,363 | $695,000 | $707,000 | $400 | 1.02 | 66 | 89 |
| 5474 Shorefront Drive | San Diego | 2022 | 10/26/2026 | 3 | 3 | 1,703 | 0 | $645,900 | $656,000 | $385 | 1.02 | 191 | 84 |
| 5460 shorefront Drive | San Diego | 2023 | 09/16/2026 | 3 | 3 | 1,703 | 0 | $615,000 | $648,000 | $381 | 1.05 | 62 | 84 |
| 1655 Sandbanks Drive | San Diego | 2022 | 09/29/2026 | 3 | 3 | 1,785 | 0 | $649,000 | $676,000 | $379 | 1.04 | 82 | 83 |
| Total: 5 · Average | 3.2 | 3.2 | 1,710 | 126,184.5 | $665,400 | $665,400 | $389.4 | — | 92.6 | ||||
| Median | 1,703 | $656,000 | $656,000 | ||||||||||
Market Analysis
List vs Sale $/SqFt
Sale Price Trend
Days on Market
Sale vs List Price
This analysis was generated automatically from MLS data. For an in-depth, human-reviewed valuation, contact Joseph Sardella at josephsardella@gmail.com.