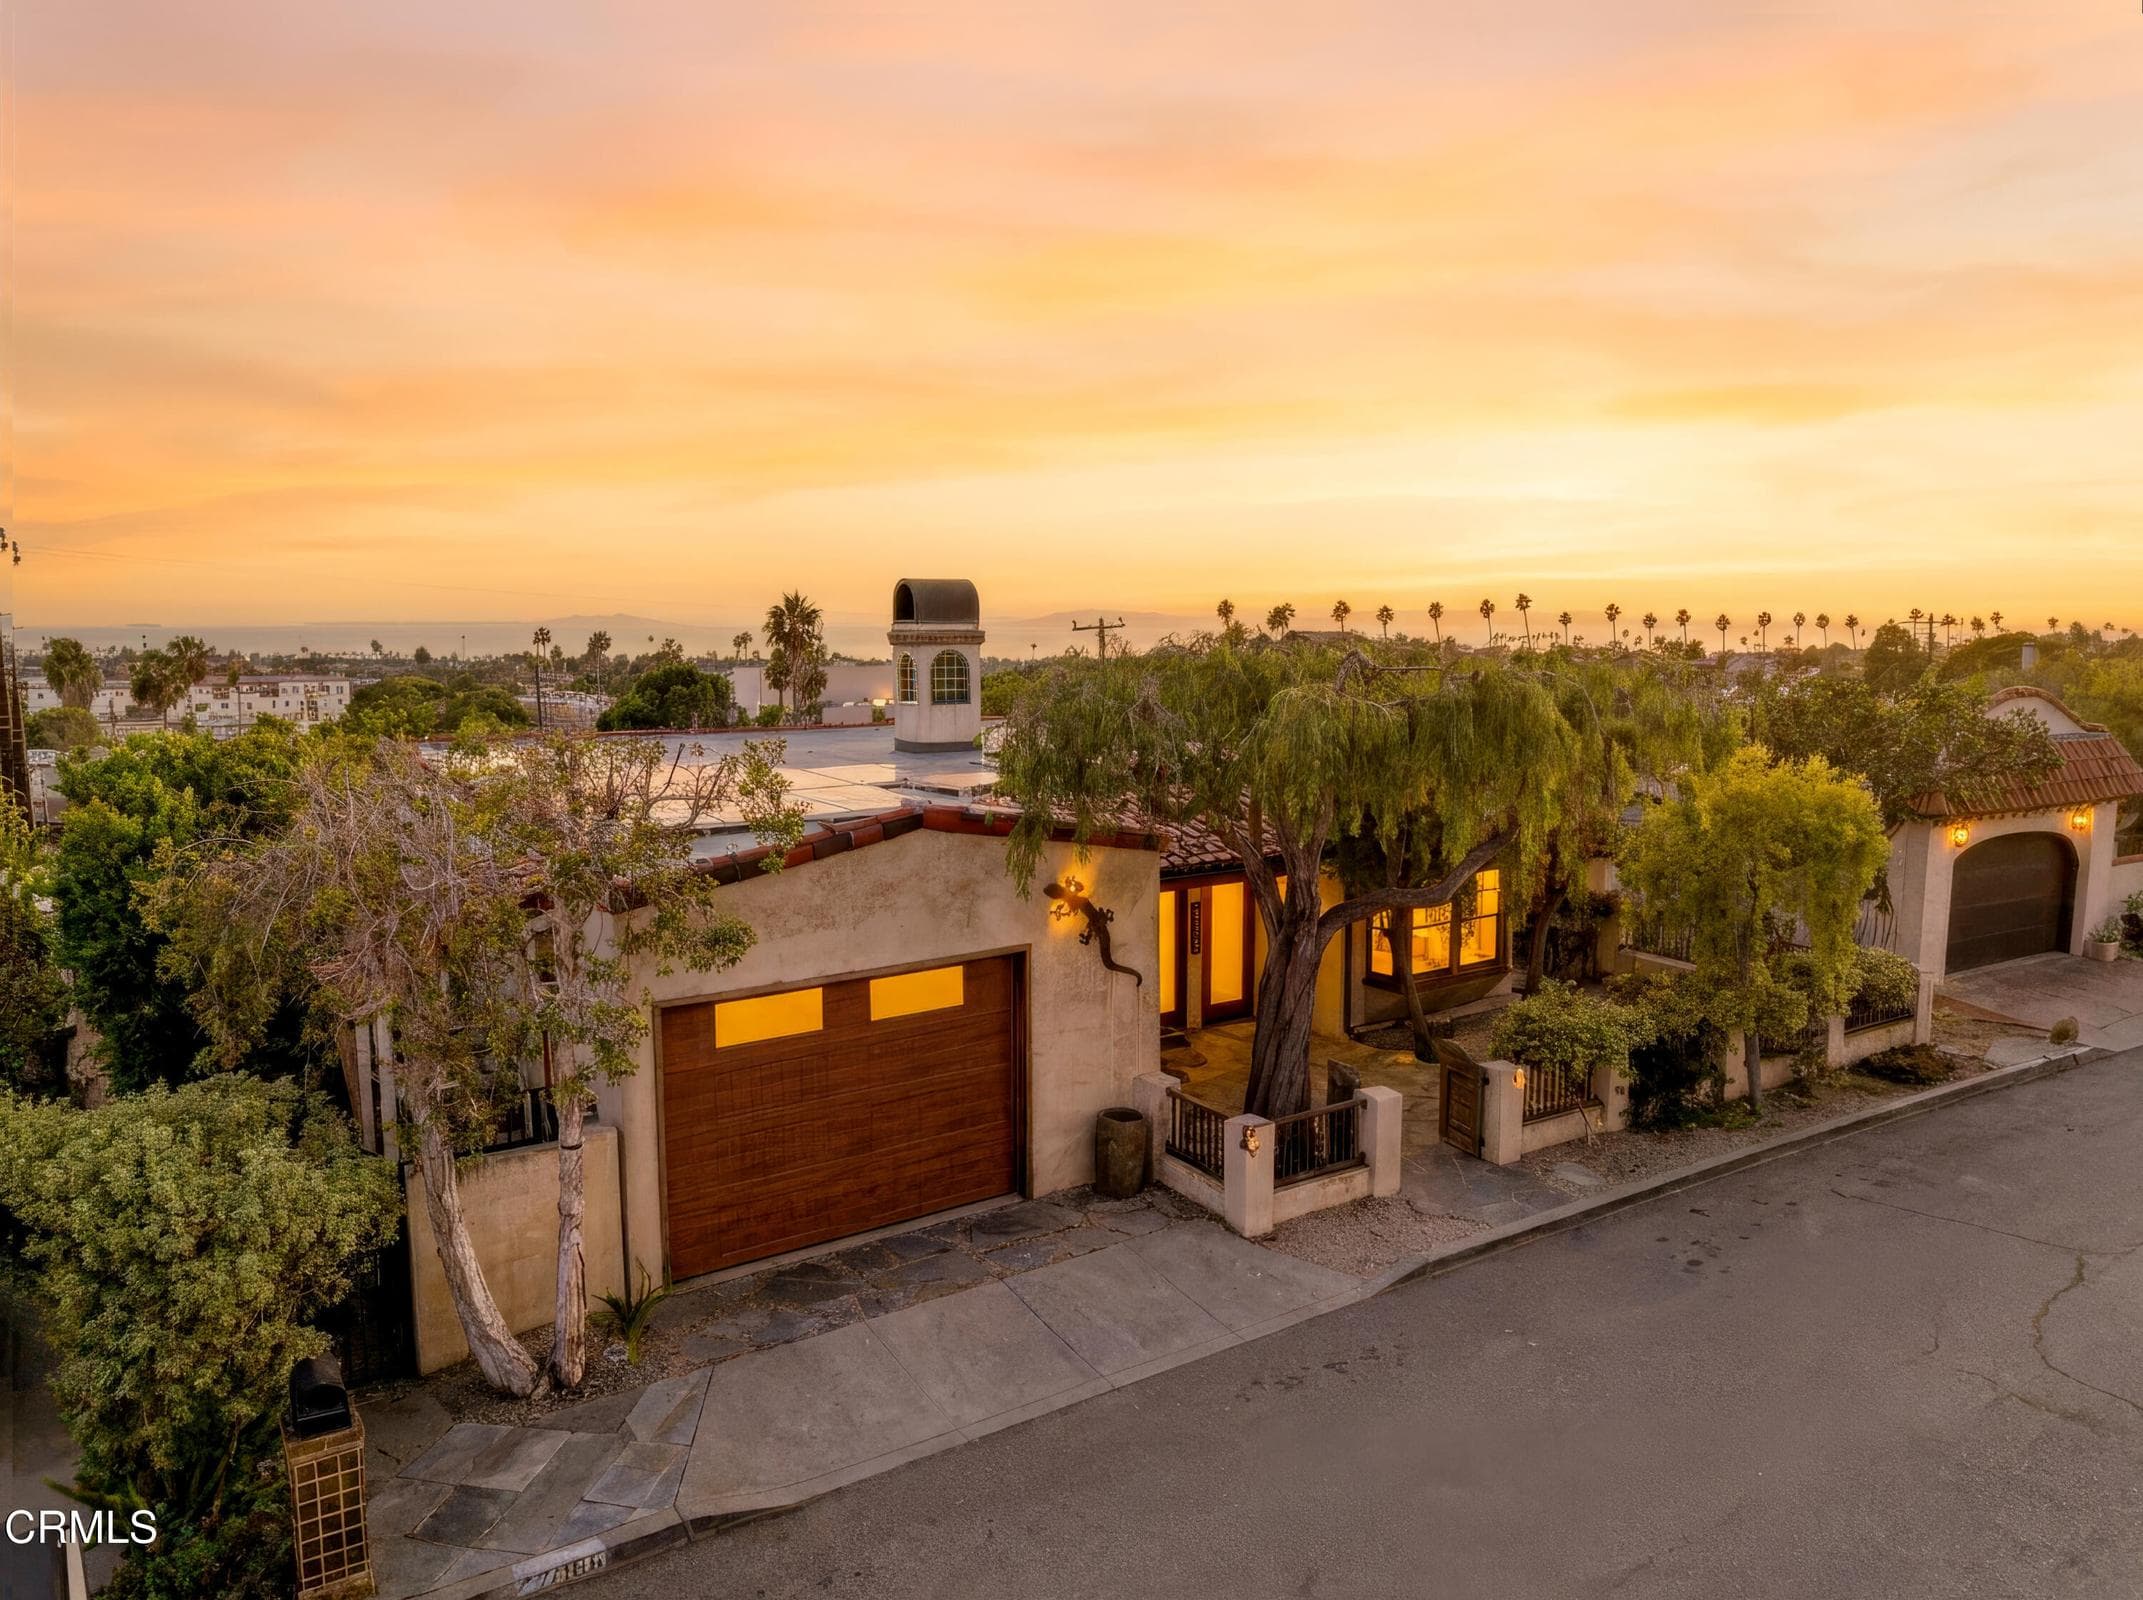
2166 Palomar Avenue, Ventura, CA 93001
2166 Palomar Avenue, Ventura, CA 93001
Property Description
Ventura Views, above the city, with the Pacific across the horizon. Taken to the studs in 2005 and rebuilt from the inside out, this custom Spanish residence in Ventura Heights opens 180-degree ocean, island and coastline views from both levels. Skylit great room, four doors to a full-width viewing deck, granite island kitchen with double ovens and gas cooktop. Main-level bedroom with full bath and an ocean facing nursery/office. Below, a primary suite with a wall of built-ins, a picture window over the backyard with peeks of the ocean, a flex space or dressing room, and a dual-vanity bath with jetted tub and oversized walk-in shower. Media room, third bedroom with loft, half bath and laundry. Flagstone patios, citrus, bocce court, outdoor shower, rooftop vantage. Owned solar, EV-ready.
Features & Amenities
Property Details
Mortgage Calculator
Current Rates
Comparative Market Analysis
Luxury Tier · 4 active · 5 closed
Ventura · Single Family Residence
Listed 6.3% below the median closed sale of $2,400,000. Price per sqft ($719) is a 20% discount to closed comps ($902). Luxury tier — fewer comparable sales widen the confidence range.
Price Position
Priced below the market — value advantage over the field.
Active Properties (4)
Active Comparables
| Address | City | Year | BD | BTH | SqFt | LotSz | LP/SqFt | LP | DIM | Score |
|---|---|---|---|---|---|---|---|---|---|---|
| 2897 Grove Street | Ventura | 1958 | 3 | 2 | 2,268 | 14,810 | $924 | $2.10M | 39 | 67 |
| 999 Waterbury Lane | Ventura | 1952 | 4 | 3 | 2,520 | 3,571 | $792 | $2.00M | 102 | 60 |
| 1111 Dover Lane | Ventura | 2015 | 4 | 4 | 2,267 | 3,484 | $1,081 | $2.45M | 81 | 56 |
| 1248 Marthas Vineyard Court | Ventura | 1954 | 4 | 3 | 1,876 | 3,484 | $1,063 | $2.00M | 144 | 53 |
| Total: 4 · Average | 3.8 | 3.0 | 2,232.75 | 6,337.25 | $965 | $2.13M | 91.5 | |||
| Median | 2,268 | $2.10M | ||||||||
Closed Properties (5)
Closed Comparables
| Address | City | Year | Date | BD | BTH | SqFt | LotSz | LP | SP | SP/SqFt | SP/LP | DIM | Score |
|---|---|---|---|---|---|---|---|---|---|---|---|---|---|
| 1583 Church Street | Ventura | 2013 | 08/26/2026 | 3 | 3 | 2,595 | 4,792 | $2.50M | $2.56M | $987 | 1.02 | 41 | 86 |
| 1736 Marisol Drive | Ventura | 1989 | 07/13/2026 | 4 | 4 | 4,100 | 9,661 | $2.60M | $2.51M | $611 | 0.96 | 104 | 76 |
| 325 Catalina Street | Ventura | 2004 | 12/24/2025 | 3 | 4 | 3,460 | 26,571 | $2.75M | $2.40M | $694 | 0.87 | 318 | 70 |
| 3086 GROVE Street | Ventura | 1980 | 10/12/2026 | 3 | 3 | 2,286 | 8,750 | $2.10M | $2.06M | $903 | 0.98 | 43 | 67 |
| 25 Encinal Place | Ventura | 1937 | 08/10/2026 | 2 | 2 | 1,554 | 8,168 | $1.99M | $2.04M | $1,313 | 1.03 | 33 | 64 |
| Total: 5 · Average | 3.0 | 3.2 | 2,799 | 11,588.4 | $2.31M | $2.31M | $901.6 | — | 107.8 | ||||
| Median | 2,595 | $2.40M | $2.40M | ||||||||||
Market Analysis
List vs Sale $/SqFt
Sale Price Trend
Days on Market
Sale vs List Price
This analysis was generated automatically from MLS data. For an in-depth, human-reviewed valuation, contact Joseph Sardella at josephsardella@gmail.com.