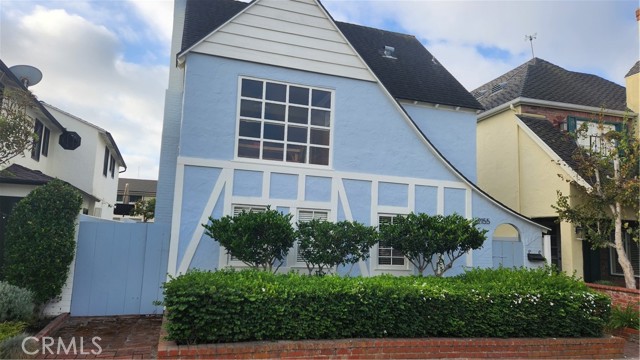
2155 Miramar, Newport Beach, CA 92661
2155 Miramar, Newport Beach, CA 92661
Property Description
Great opportunity to build your custom Beach House on quiet Miramar Ave. Close to the famous Newport beach "Wedge". Property sold "as is". Sellers makes no warranties expressed or implied. Sellers to make no repairs whatsoever. Value is in the land. Available to show on 10/27/26. Open house on 10/30/26. 11am to 2pm. Seller will be reviewing offers on 10/31/26.
Features & Amenities
Property Details
Mortgage Calculator
Current Rates
Comparative Market Analysis
Luxury Tier · 5 active · 5 closed
Newport Beach · Single Family Residence
Listed 7.5% above the median closed sale of $3,650,000. Closed comps sold at 102% of list — strong seller's market. Comparable homes are moving quickly (avg 26 days on market). Luxury tier — fewer comparable sales widen the confidence range.
Price Position
Positioned above the market — commands a premium.
Active Properties (5)
Active Comparables
| Address | City | Year | BD | BTH | SqFt | LotSz | LP/SqFt | LP | DIM | Score |
|---|---|---|---|---|---|---|---|---|---|---|
| 500 Acacia | Corona del Mar | 1934 | 2 | 2 | 922 | 1,830 | $3,791 | $3.50M | 177 | 78 |
| 211 Bay | Newport Beach | 2009 | 3 | 4 | 2,668 | 2,400 | $1,572 | $4.20M | 261 | 56 |
| 428 Bay Avenue | Newport Beach | 1997 | 3 | 5 | 2,595 | 2,164 | $1,501 | $3.90M | 123 | 55 |
| 2 Maritime Drive | Corona del Mar | 1978 | 2 | 2 | 1,911 | 9,730 | $2,041 | $3.90M | 13 | 54 |
| 4 Skysail | Corona del Mar | 1978 | 3 | 3 | 1,917 | 5,427 | $1,982 | $3.80M | 15 | 54 |
| Total: 5 · Average | 2.6 | 3.2 | 2,002.6 | 4,310.2 | $2,177.4 | $3.86M | 117.8 | |||
| Median | 1,917 | $3.90M | ||||||||
Closed Properties (5)
Closed Comparables
| Address | City | Year | Date | BD | BTH | SqFt | LotSz | LP | SP | SP/SqFt | SP/LP | DIM | Score |
|---|---|---|---|---|---|---|---|---|---|---|---|---|---|
| 449 M Street | Newport Beach | 1951 | 10/29/2026 | 3 | 2 | 1,174 | 2,765 | $3.40M | $3.80M | $3,237 | 1.12 | 29 | 92 |
| 1713 Miramar Drive | Newport Beach | 1929 | 09/04/2026 | 3 | 2 | 1,152 | 2,450 | $3.40M | $3.55M | $3,082 | 1.05 | 41 | 92 |
| 420 Acacia | Newport Beach | 1952 | 10/13/2026 | 3 | 2 | 1,210 | 2,700 | $3.55M | $3.55M | $2,934 | 1.00 | 0 | 90 |
| 2156 Ocean | Newport Beach | 1955 | 08/25/2026 | 3 | 2 | 1,069 | 3,060 | $3.96M | $3.80M | $3,555 | 0.96 | 29 | 89 |
| 2012 Ocean Boulevard | Newport Beach | 1955 | 09/28/2026 | 4 | 3 | 1,643 | 2,625 | $3.75M | $3.65M | $2,222 | 0.97 | 31 | 89 |
| Total: 5 · Average | 3.2 | 2.2 | 1,249.6 | 2,720 | $3.67M | $3.67M | $3,006 | — | 26 | ||||
| Median | 1,174 | $3.65M | $3.65M | ||||||||||
Market Analysis
List vs Sale $/SqFt
Sale Price Trend
Days on Market
Sale vs List Price
This analysis was generated automatically from MLS data. For an in-depth, human-reviewed valuation, contact Joseph Sardella at josephsardella@gmail.com.