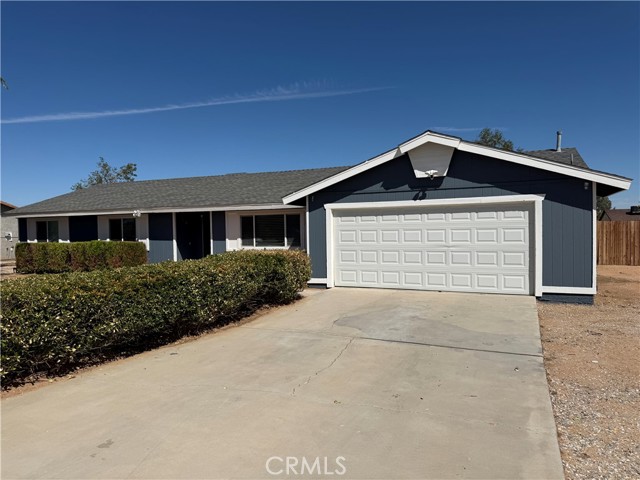
21360 Sandia, Apple Valley, CA 92308
21360 Sandia, Apple Valley, CA 92308
Property Description
Beautifully updated single-story home offering comfortable living and exceptional outdoor space in a desirable Apple Valley location. The inviting interior features a flexible bonus room, ideal for a private office, den, or additional living space. Outside, enjoy a generously sized yard with mature trees, a covered patio, and a fire pit creating the perfect setting for relaxing or entertaining. Conveniently located within walking distance of both Sandia Elementary School and Apple Valley High School. A wonderful blend of style, comfort, and everyday convenience.
Features & Amenities
Property Details
Mortgage Calculator
Current Rates
Comparative Market Analysis
Affordable Tier · 5 active · 5 closed
Apple Valley · Single Family Residence
Listed 4.2% above the median closed sale of $408,000. Price per sqft ($239) is a 11% discount to closed comps ($268). Closed comps sold at 101% of list — strong seller's market.
Price Position
Aligned with the market — fair pricing for the comps.
Active Properties (5)
Active Comparables
| Address | City | Year | BD | BTH | SqFt | LotSz | LP/SqFt | LP | DIM | Score |
|---|---|---|---|---|---|---|---|---|---|---|
| 11746 Mohawk Road | Apple Valley | 1986 | 3 | 2 | 1,389 | 19,762 | $266 | $369,999 | 48 | 92 |
| 21064 Sioux | Apple Valley | 1982 | 3 | 2 | 1,598 | 18,000 | $244 | $389,900 | 12 | 85 |
| 21775 Sioux Road | Apple Valley | 1980 | 3 | 2 | 1,568 | 69,260 | $265 | $414,900 | 3 | 84 |
| 11425 Kiowa Road | Apple Valley | 1981 | 4 | 2 | 1,416 | 18,000 | $282 | $399,900 | 26 | 81 |
| 11761 Jamacha | Apple Valley | 1964 | 5 | 2 | 2,168 | 18,594 | $208 | $450,000 | 90 | 80 |
| Total: 5 · Average | 3.6 | 2.0 | 1,627.8 | 28,723.2 | $253 | $404,939.8 | 35.8 | |||
| Median | 1,568 | $399,900 | ||||||||
Closed Properties (5)
Closed Comparables
| Address | City | Year | Date | BD | BTH | SqFt | LotSz | LP | SP | SP/SqFt | SP/LP | DIM | Score |
|---|---|---|---|---|---|---|---|---|---|---|---|---|---|
| 11875 Morning Star | Apple Valley | 1990 | 05/26/2026 | 4 | 2 | 2,005 | 18,800 | $430,000 | $435,000 | $217 | 1.01 | 102 | 88 |
| 21495 Minodoka Road | Apple Valley | 1985 | 08/04/2026 | 3 | 2 | 1,552 | 19,200 | $398,000 | $408,000 | $263 | 1.02 | 33 | 88 |
| 20852 Del Oro Road | Apple Valley | 1987 | 07/27/2026 | 3 | 2 | 1,417 | 18,139 | $395,000 | $395,000 | $279 | 1.00 | 88 | 87 |
| 11072 Moki Court | Apple Valley | 1987 | 10/07/2026 | 3 | 2 | 1,281 | 21,200 | $400,000 | $405,000 | $316 | 1.01 | 79 | 86 |
| 12348 Omak Road | Apple Valley | 1980 | 08/17/2026 | 3 | 2 | 1,592 | 18,000 | $419,900 | $419,900 | $264 | 1.00 | 88 | 85 |
| Total: 5 · Average | 3.2 | 2.0 | 1,569.4 | 19,067.8 | $412,580 | $412,580 | $267.8 | — | 78 | ||||
| Median | 1,552 | $408,000 | $408,000 | ||||||||||
Market Analysis
List vs Sale $/SqFt
Sale Price Trend
Days on Market
Sale vs List Price
This analysis was generated automatically from MLS data. For an in-depth, human-reviewed valuation, contact Joseph Sardella at josephsardella@gmail.com.