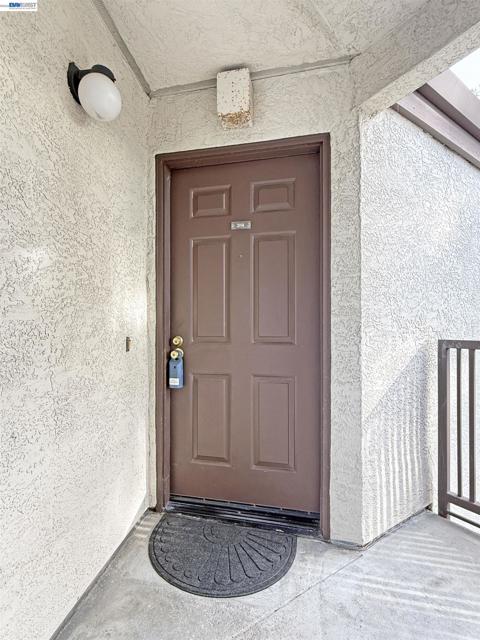
21314 Gary Dr, 314, Hayward, CA 94546
21314 Gary Dr, 314, Hayward, CA 94546
Property Description
Welcome to Mesa Verde! This 2 bedroom, 2 bathroom condo has an updated kitchen, laminate flooring throughout the living areas, carpet in the bedroom, a laundry closet, dining area, and all appliances are included.
Features & Amenities
Property Details
Mortgage Calculator
Current Rates
About Mesa Verde
This property is located in Mesa Verde, a community in Hayward. Explore more listings in this neighborhood to compare options and pricing.
View Mesa Verde ListingsComparative Market Analysis
Affordable Tier · 5 active · 5 closed
Mesa Verde · Hayward · Condominium
Listed 5.6% below the median closed sale of $450,000. Price per sqft ($386) is a 12% discount to closed comps ($439). Expect a longer timeline — comps averaged 135 days on market.
Price Position
Priced below the market — value advantage over the field.
Active Properties (5)
Active Comparables
| Address | City | Year | BD | BTH | SqFt | LotSz | LP/SqFt | LP | DIM | Score |
|---|---|---|---|---|---|---|---|---|---|---|
| 21103 Gary | Castro Valley | 1993 | 2 | 2 | 1,100 | 0 | $408 | $449,000 | 41 | 94 |
| 21062 Gary Dr | Hayward | 1980 | 2 | 1 | 941 | 135,583 | $489 | $460,000 | 93 | 75 |
| 722 Kino Ct | Hayward | 1982 | 2 | 2 | 1,070 | 34,720 | $374 | $399,888 | 100 | 68 |
| 16006 E.14th Street | 1987 | 2 | 2 | 901 | 45,875 | $443 | $399,000 | 62 | 67 | |
| 25129 Copa Del Oro Dr | Hayward | 1991 | 1 | 1 | 608 | 256,074 | $623 | $379,000 | 26 | 45 |
| Total: 5 · Average | 1.8 | 1.6 | 924 | 118,063 | $467.4 | $417,377.6 | 64.4 | |||
| Median | 941 | $399,888 | ||||||||
Closed Properties (5)
Closed Comparables
| Address | City | Year | Date | BD | BTH | SqFt | LotSz | LP | SP | SP/SqFt | SP/LP | DIM | Score |
|---|---|---|---|---|---|---|---|---|---|---|---|---|---|
| 21103 Gary Dr | Hayward | 1993 | 09/18/2026 | 2 | 2 | 1,025 | 120,194 | $475,000 | $450,000 | $439 | 0.95 | 87 | 92 |
| 21239 Gary Dr | Hayward | 1992 | 11/20/2025 | 2 | 2 | 1,100 | 124,670 | $450,000 | $450,000 | $409 | 1.00 | 190 | 91 |
| 21239 Gary Dr | Hayward | 1992 | 01/20/2026 | 2 | 2 | 1,025 | 124,670 | $450,000 | $443,000 | $432 | 0.98 | 251 | 89 |
| 21062 Gary Dr | Hayward | 1980 | 08/28/2026 | 2 | 2 | 1,050 | 135,583 | $525,000 | $475,000 | $452 | 0.91 | 99 | 89 |
| 21109 Gary Dr | Hayward | 1981 | 06/01/2026 | 2 | 2 | 1,041 | 394,991 | $475,000 | $484,000 | $465 | 1.02 | 46 | 86 |
| Total: 5 · Average | 2.0 | 2.0 | 1,048.2 | 180,021.6 | $460,400 | $460,400 | $439.4 | — | 134.6 | ||||
| Median | 1,041 | $450,000 | $450,000 | ||||||||||
Market Analysis
List vs Sale $/SqFt
Sale Price Trend
Days on Market
Sale vs List Price
This analysis was generated automatically from MLS data. For an in-depth, human-reviewed valuation, contact Joseph Sardella at josephsardella@gmail.com.