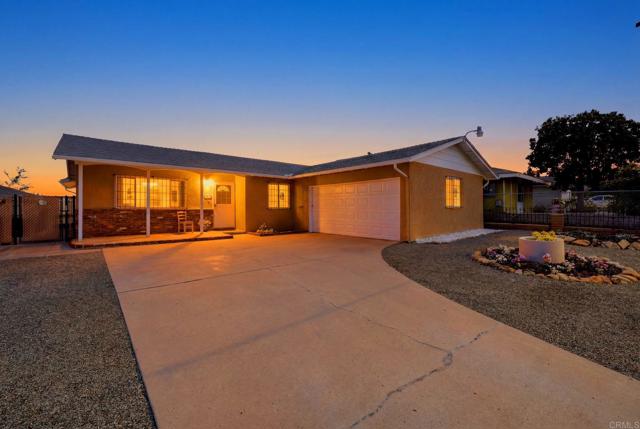
2121 East 4Th Street, National City, CA 91950
2121 East 4Th Street, National City, CA 91950
Property Description
$25,000 reasons to read this listing. The seller is offering up to $25,000 in closing cost credits with the right offer. Buy down your rate. Keep cash in your pocket. Walk in with equity already working for you. That’s not a gimmick — that’s a head start. And the home backs it up. Upgraded Milgaard windows. High-efficiency HVAC with instant-cool AC that actually delivers. A permitted family room addition giving you more square footage - because the owners invested in this place, not just lived in it. Only the second time this home has ever hit the market. That kind of ownership shows up in the details. Clean yard. Easy to maintain. Attached 2-car garage. Move-in ready without the renovation drama. This is the one buyers walk through and immediately call their agent. Don’t be the one who waited a day too long.
Features & Amenities
Property Details
Mortgage Calculator
Current Rates
Comparative Market Analysis
Residential Tier · 5 active · 5 closed
National City · Single Family Residence
Listed in line with the median closed sale of $736,000. Price per sqft ($491) is a 21% discount to closed comps ($625).
Price Position
Aligned with the market — fair pricing for the comps.
Active Properties (5)
Active Comparables
| Address | City | Year | BD | BTH | SqFt | LotSz | LP/SqFt | LP | DIM | Score |
|---|---|---|---|---|---|---|---|---|---|---|
| 2325 14Th Street | National City | 1977 | 3 | 2 | 1,514 | 6,534 | $495 | $749,000 | 5 | 83 |
| 3002 11th Street | National City | 1965 | 3 | 2 | 1,648 | 6,534 | $464 | $764,000 | 95 | 82 |
| 3140 2nd Street | National City | 1959 | 3 | 2 | 1,565 | 7,500 | $518 | $810,000 | 163 | 81 |
| 1003 Manchester Street | National City | 1959 | 3 | 2 | 1,802 | 8,276 | $472 | $849,999 | 32 | 76 |
| 1810 Granger Avenue | National City | 1950 | 4 | 2 | 1,032 | 5,662 | $751 | $775,000 | 16 | 73 |
| Total: 5 · Average | 3.2 | 2.0 | 1,512.2 | 6,901.2 | $540 | $789,599.8 | 62.2 | |||
| Median | 1,565 | $775,000 | ||||||||
Closed Properties (5)
Closed Comparables
| Address | City | Year | Date | BD | BTH | SqFt | LotSz | LP | SP | SP/SqFt | SP/LP | DIM | Score |
|---|---|---|---|---|---|---|---|---|---|---|---|---|---|
| 2534 Melrose Street | National City | 1961 | 09/15/2026 | 3 | 2 | 1,337 | 5,400 | $719,900 | $725,000 | $542 | 1.01 | 54 | 88 |
| 2526 Melrose Street | National City | 1961 | 07/10/2026 | 3 | 2 | 1,088 | 5,400 | $736,000 | $736,000 | $676 | 1.00 | 39 | 84 |
| 2525 Melrose Street | National City | 1960 | 12/02/2025 | 3 | 2 | 1,053 | 6,700 | $675,000 | $690,000 | $655 | 1.02 | 39 | 78 |
| 1901 Beta Street | National City | 1955 | 08/04/2026 | 3 | 2 | 1,064 | 8,300 | $849,000 | $835,000 | $785 | 0.98 | 118 | 77 |
| 1341 4th Street | National City | 1952 | 06/24/2026 | 4 | 3 | 1,700 | 6,537 | $819,900 | $790,000 | $465 | 0.96 | 109 | 77 |
| Total: 5 · Average | 3.2 | 2.2 | 1,248.4 | 6,467.4 | $755,200 | $755,200 | $624.6 | — | 71.8 | ||||
| Median | 1,088 | $736,000 | $736,000 | ||||||||||
Market Analysis
List vs Sale $/SqFt
Sale Price Trend
Days on Market
Sale vs List Price
This analysis was generated automatically from MLS data. For an in-depth, human-reviewed valuation, contact Joseph Sardella at josephsardella@gmail.com.