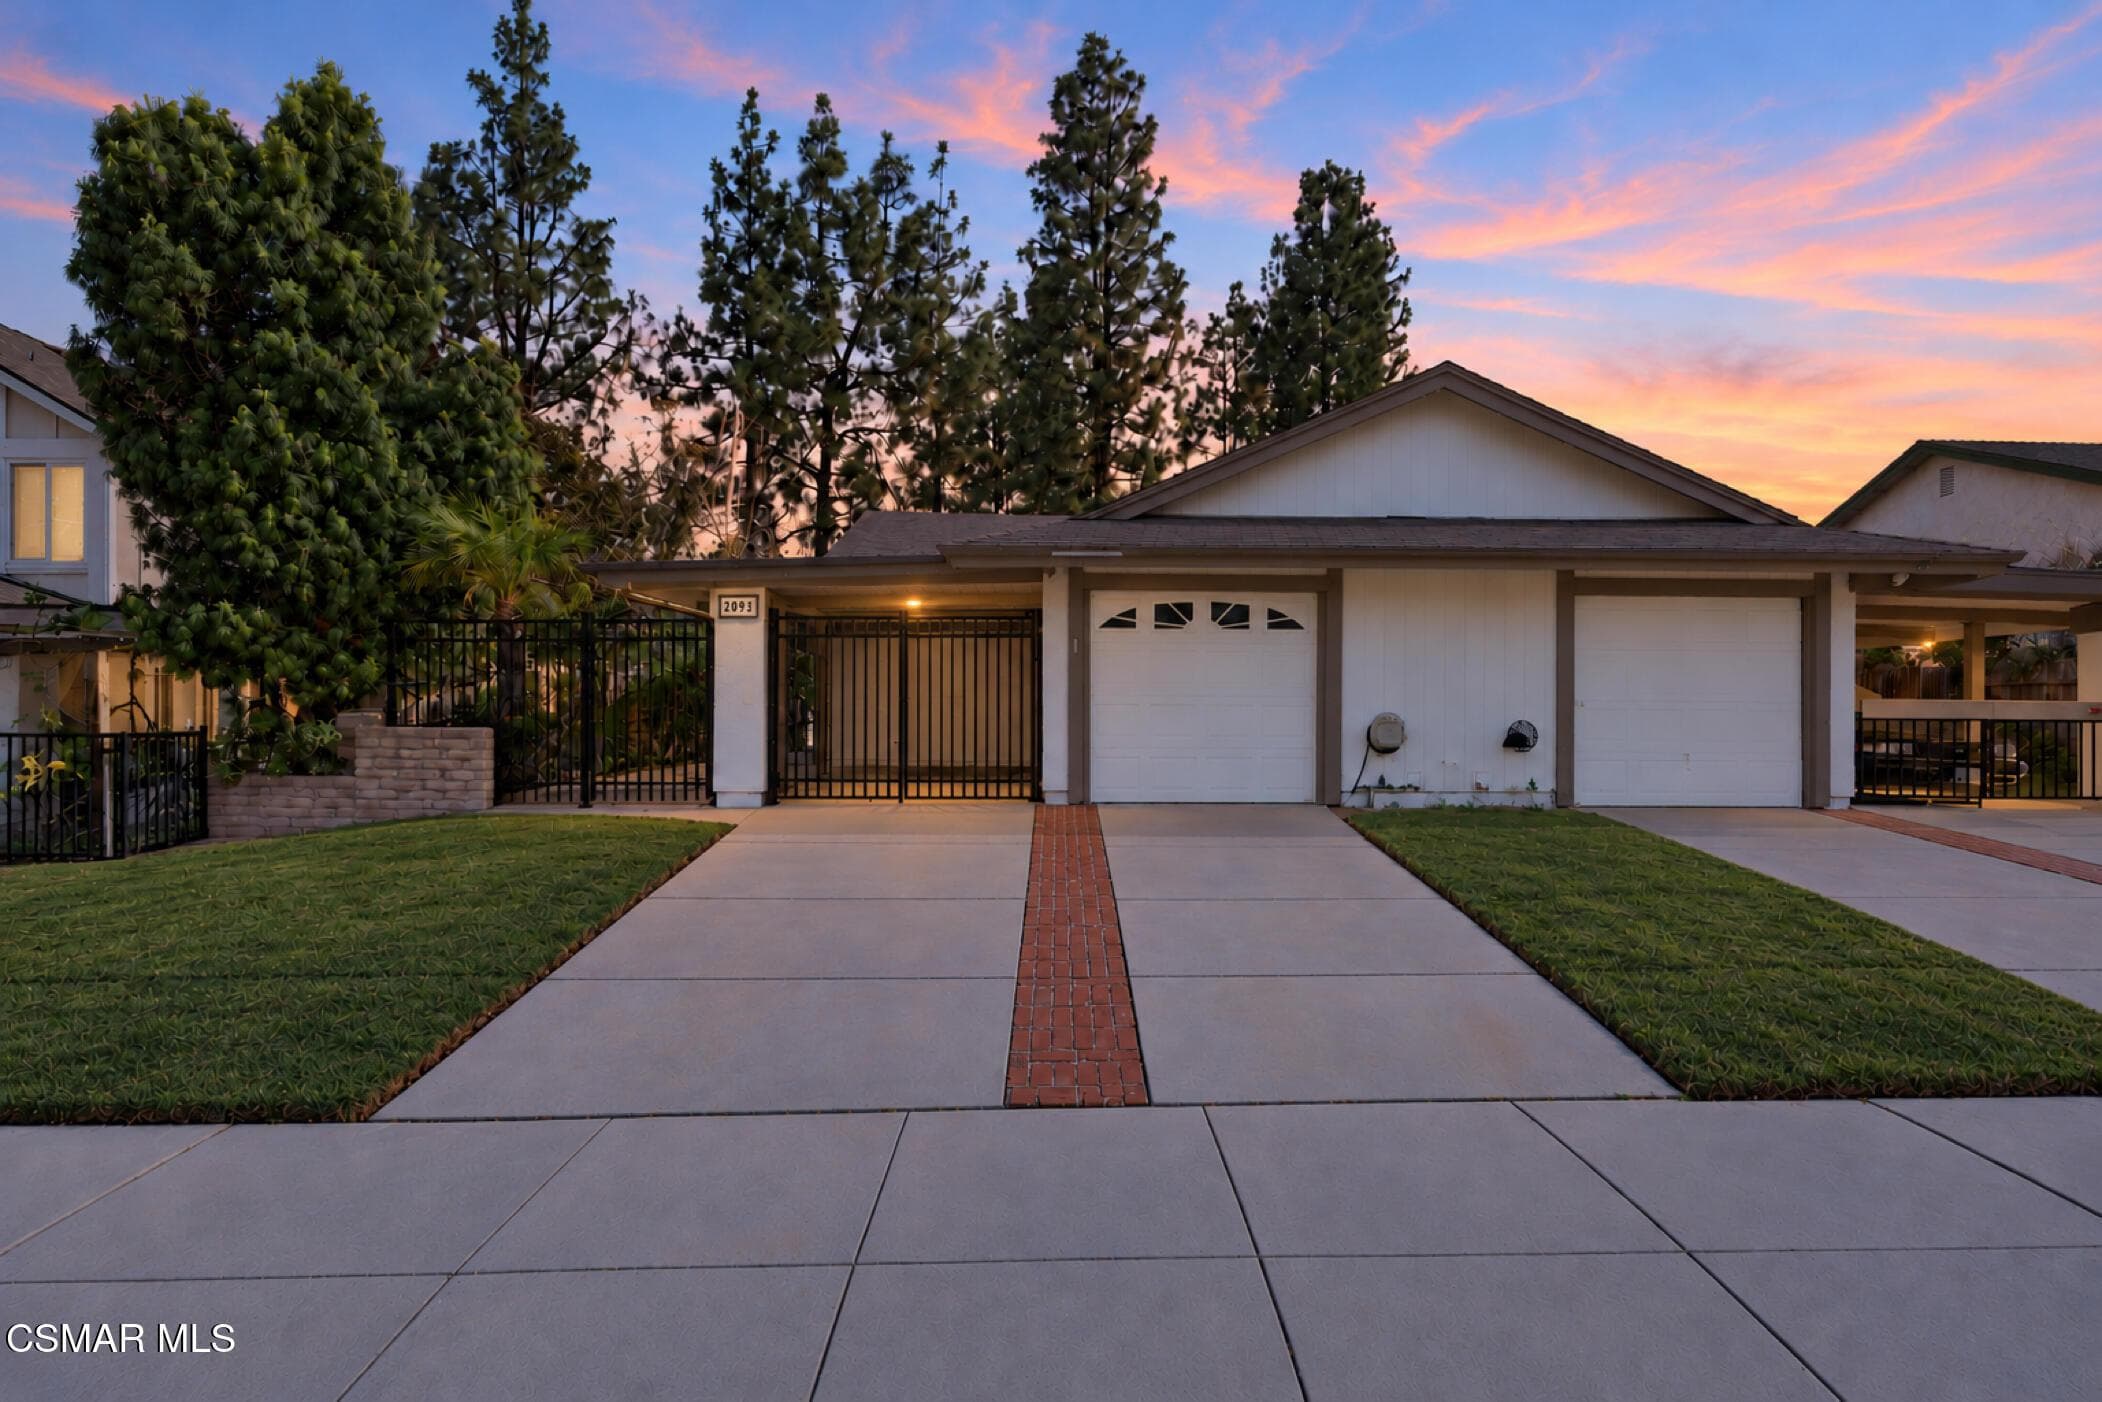
2093 Covington Avenue, Simi Valley, CA 93065
2093 Covington Avenue, Simi Valley, CA 93065
Property Description
Welcome to 2093 Covington Avenue in Simi Valley, where great value meets a home with some serious personality. This home offers two bedrooms, two bathrooms, and an inviting interior that's anything but ordinary. The vaulted ceilings with exposed blonde wood beams give the living area a distinctive look, bringing warmth, character, and an open feel to the space. The kitchen features beautiful white cabinetry, granite countertops, and a bright, clean design. The home is nicely maintained and offers a comfortable, inviting space that's ready to enjoy. And then there's the backyard. A grassy lawn, a private spa, and room to relax or entertain. It's the kind of outdoor space that makes this property stand out, especially at this price point.
Features & Amenities
Property Details
Mortgage Calculator
Current Rates
About Hollow Hills-219
This property is located in Hollow Hills-219, a community in Simi Valley. Explore more listings in this neighborhood to compare options and pricing.
View Hollow Hills-219 ListingsComparative Market Analysis
Affordable Tier · 5 active · 5 closed
Hollow Hills-219 · Simi Valley · Single Family Residence
Listed in line with the median closed sale of $602,000. Price per sqft ($626) is a 33% premium to closed comps ($471).
Price Position
Aligned with the market — fair pricing for the comps.
Active Properties (5)
Active Comparables
| Address | City | Year | BD | BTH | SqFt | LotSz | LP/SqFt | LP | DIM | Score |
|---|---|---|---|---|---|---|---|---|---|---|
| 2395 Century | Simi Valley | 1973 | 2 | 1 | 1,108 | 5,662 | $631 | $699,000 | 90 | 60 |
| 895 Appleton Road | Simi Valley | 1964 | 3 | 2 | 1,684 | 7,405 | $413 | $695,000 | 61 | 57 |
| 1207 Graham Street | Simi Valley | 1961 | 4 | 2 | 1,226 | 7,840 | $570 | $699,000 | 16 | 57 |
| 4328 Shopping Lane | Simi Valley | 1963 | 3 | 1 | 1,141 | 6,534 | $605 | $689,900 | 58 | 52 |
| 2567 Chandler Avenue | Simi Valley | 1987 | 3 | 3 | 1,378 | 2,401 | $450 | $619,950 | 17 | 52 |
| Total: 5 · Average | 3.0 | 1.8 | 1,307.4 | 5,968.4 | $533.8 | $680,570 | 48.4 | |||
| Median | 1,226 | $695,000 | ||||||||
Closed Properties (5)
Closed Comparables
| Address | City | Year | Date | BD | BTH | SqFt | LotSz | LP | SP | SP/SqFt | SP/LP | DIM | Score |
|---|---|---|---|---|---|---|---|---|---|---|---|---|---|
| 2041 Covington Avenue | Simi Valley | 1974 | 08/06/2026 | 2 | 2 | 982 | 3,484 | $600,000 | $586,000 | $597 | 0.98 | 52 | 86 |
| 2044 Covington Avenue | Simi Valley | 1974 | 04/22/2026 | 2 | 2 | 1,162 | 4,791 | $625,000 | $625,000 | $538 | 1.00 | 116 | 79 |
| 2098 Covington Avenue | Simi Valley | 1974 | 07/31/2026 | 3 | 2 | 1,400 | 3,484 | $605,000 | $602,000 | $430 | 0.99 | 254 | 70 |
| 2079 Covington Avenue | Simi Valley | 1974 | 09/11/2026 | 3 | 2 | 1,570 | 3,484 | $599,000 | $602,000 | $383 | 1.00 | 50 | 68 |
| 2018 Covington Avenue | Simi Valley | 1974 | 07/02/2026 | 3 | 3 | 1,557 | 4,356 | $649,000 | $630,000 | $405 | 0.97 | 29 | 61 |
| Total: 5 · Average | 2.6 | 2.2 | 1,334.2 | 3,919.8 | $609,000 | $609,000 | $470.6 | — | 100.2 | ||||
| Median | 1,400 | $602,000 | $602,000 | ||||||||||
Market Analysis
List vs Sale $/SqFt
Sale Price Trend
Days on Market
Sale vs List Price
This analysis was generated automatically from MLS data. For an in-depth, human-reviewed valuation, contact Joseph Sardella at josephsardella@gmail.com.