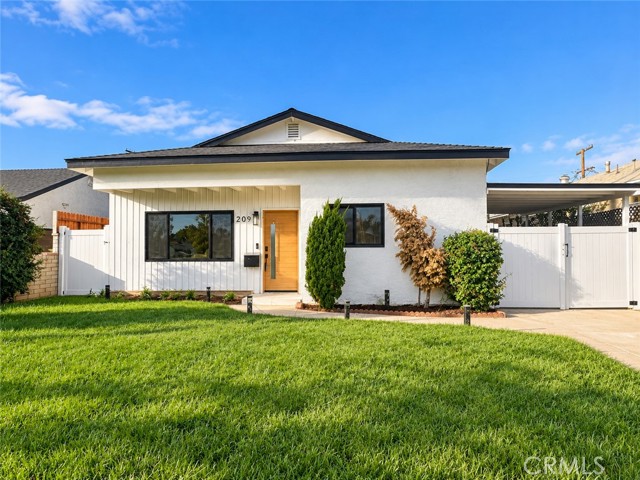
209 West Markland, Monterey Park, CA 91754
209 West Markland, Monterey Park, CA 91754
Property Description
Welcome to this beautifully renovated single-story contemporary home, where modern elegance meets everyday comfort. Thoughtfully updated with warm neutral tones, wide-plank flooring, contemporary finishes, and stylish fixtures throughout. The home features an inviting living room, a beautifully updated kitchen with warm wood cabinetry, sleek countertops, and elegant accents. A spacious family room and thoughtfully designed living areas offer flexibility for entertaining and relaxing. Enjoy beautifully remodeled bathrooms, including a primary bathroom featuring a freestanding soaking tub, walk-in shower, and double vanity. A convenient wet bar adds an extra touch of style and functionality. Outside, the refreshed exterior, inviting front lawn, and private outdoor spaces complete this move-in-ready home. Modern Style. Move-In Ready. Bring your buyers today for their dream home which won't last long.
Features & Amenities
Property Details
Mortgage Calculator
Current Rates
Comparative Market Analysis
Residential Tier · 5 active · 5 closed
Monterey Park · Single Family Residence
Listed in line with the median closed sale of $1,059,000. Closed comps sold at 103% of list — strong seller's market.
Price Position
Aligned with the market — fair pricing for the comps.
Active Properties (5)
Active Comparables
| Address | City | Year | BD | BTH | SqFt | LotSz | LP/SqFt | LP | DIM | Score |
|---|---|---|---|---|---|---|---|---|---|---|
| 2009 Graylock Avenue | Monterey Park | 1949 | 3 | 3 | 1,698 | 5,982 | $618 | $1.05M | 34 | 93 |
| 108 Coral View | Monterey Park | 1954 | 3 | 2 | 1,478 | 6,011 | $643 | $949,888 | 27 | 90 |
| 401 Doncrest Street | Monterey Park | 1950 | 3 | 2 | 1,273 | 6,109 | $730 | $928,888 | 11 | 89 |
| 1343 Garfield | Monterey Park | 1953 | 4 | 2 | 1,714 | 9,286 | $582 | $998,000 | 4 | 85 |
| 405 Van Buren | Monterey Park | 1964 | 4 | 2 | 1,902 | 6,373 | $657 | $1.25M | 2 | 84 |
| Total: 5 · Average | 3.4 | 2.2 | 1,613 | 6,752.2 | $646 | $1.03M | 15.6 | |||
| Median | 1,698 | $998,000 | ||||||||
Closed Properties (5)
Closed Comparables
| Address | City | Year | Date | BD | BTH | SqFt | LotSz | LP | SP | SP/SqFt | SP/LP | DIM | Score |
|---|---|---|---|---|---|---|---|---|---|---|---|---|---|
| 1941 Fernbank Avenue | Monterey Park | 1950 | 09/09/2026 | 5 | 2 | 1,875 | 5,907 | $949,000 | $1.02M | $544 | 1.07 | 41 | 89 |
| 2024 Grandridge Ave | Monterey Park | 1949 | 06/12/2026 | 4 | 3 | 1,936 | 8,684 | $1.10M | $1.18M | $610 | 1.07 | 63 | 84 |
| 501 Floral Drive | Monterey Park | 1948 | 12/22/2025 | 3 | 3 | 1,336 | 5,759 | $950,000 | $925,000 | $692 | 0.97 | 53 | 83 |
| 150 Floral Drive | Monterey Park | 1949 | 11/10/2025 | 4 | 3 | 2,196 | 6,119 | $1.05M | $1.06M | $482 | 1.01 | 87 | 80 |
| 211 Markland Drive | Monterey Park | 1951 | 07/10/2026 | 4 | 3 | 1,900 | 6,254 | $1.05M | $1.08M | $568 | 1.03 | 89 | 79 |
| Total: 5 · Average | 4.0 | 2.8 | 1,848.6 | 6,544.6 | $1.05M | $1.05M | $579.2 | — | 66.6 | ||||
| Median | 1,900 | $1.06M | $1.06M | ||||||||||
Market Analysis
List vs Sale $/SqFt
Sale Price Trend
Days on Market
Sale vs List Price
This analysis was generated automatically from MLS data. For an in-depth, human-reviewed valuation, contact Joseph Sardella at josephsardella@gmail.com.