208 Race Street, Needles, CA 92363
208 Race Street, Needles, CA 92363
Property Description
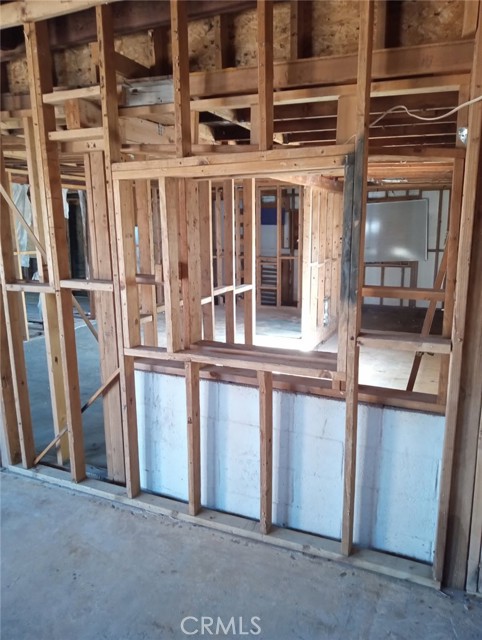
Price reduced for a quicker sale. The home is currently not livable, boarded up, and will require permits. Sheetrock has been removed throughout, and the property has been cleaned inside and out. Fully fenced, it sits on a corner lot just one block from the Colorado River and the bridge leading to the Arizona side.
Features & Amenities
Property Details
Mortgage Calculator
Current Rates
Comparative Market Analysis
Affordable Tier · 2 active · 5 closed
Needles · Single Family Residence
Listed 9.6% below the median closed sale of $119,500. Price per sqft ($82) is a 31% discount to closed comps ($118). Closed comps sold at 94% of list — buyers have negotiating leverage.
Price Position
Priced below the market — value advantage over the field.
Active Properties (2)
Active Comparables
| Address | City | Year | BD | BTH | SqFt | LotSz | LP/SqFt | LP | DIM | Score |
|---|---|---|---|---|---|---|---|---|---|---|
| 408 Bazoobuth | Needles | 1920 | 2 | 1 | 814 | 4,500 | $135 | $110,000 | 180 | 73 |
| 2045 Desoto Street | Needles | 1971 | 3 | 2 | 1,200 | 7,500 | $96 | $115,000 | 136 | 70 |
| Total: 2 · Average | 2.5 | 1.5 | 1,007 | 6,000 | $115.5 | $112,500 | 158 | |||
| Median | 1,200 | $115,000 | ||||||||
Closed Properties (5)
Closed Comparables
| Address | City | Year | Date | BD | BTH | SqFt | LotSz | LP | SP | SP/SqFt | SP/LP | DIM | Score |
|---|---|---|---|---|---|---|---|---|---|---|---|---|---|
| 1602 Collins | Needles | 1956 | 08/11/2026 | 2 | 1 | 1,201 | 4,700 | $139,000 | $120,000 | $100 | 0.86 | 133 | 79 |
| 215 Cibola | Needles | 1905 | 07/31/2026 | 2 | 1 | 1,064 | 5,000 | $124,000 | $117,500 | $110 | 0.95 | 161 | 74 |
| 519 C Street | Needles | 1940 | 01/22/2026 | 2 | 1 | 834 | 5,000 | $115,000 | $115,000 | $138 | 1.00 | 75 | 73 |
| 219 Cibola | Needles | 1905 | 05/18/2026 | 2 | 1 | 1,099 | 3,040 | $129,000 | $119,500 | $109 | 0.93 | 87 | 72 |
| 515 A Street | Needles | 1801 | 12/16/2025 | 2 | 1 | 930 | 3,750 | $130,000 | $123,000 | $132 | 0.95 | 64 | 66 |
| Total: 5 · Average | 2.0 | 1.0 | 1,025.6 | 4,298 | $119,000 | $119,000 | $117.8 | — | 104 | ||||
| Median | 1,064 | $119,500 | $119,500 | ||||||||||
Market Analysis
List vs Sale $/SqFt
Sale Price Trend
Days on Market
Sale vs List Price
This analysis was generated automatically from MLS data. For an in-depth, human-reviewed valuation, contact Joseph Sardella at josephsardella@gmail.com.