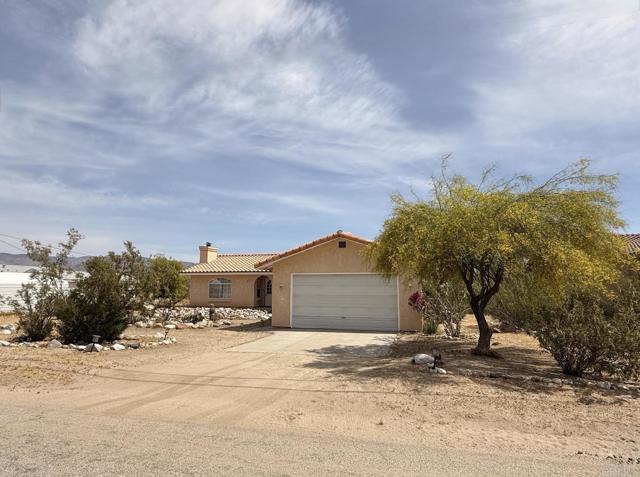
2067 Trebuchet Drive, Borrego Springs, CA 92004
2067 Trebuchet Drive, Borrego Springs, CA 92004
Property Description
Ready to trade the daily grind for desert peace? 2067 Trebuchet Dr is the perfect blend of modern comfort and rugged natural beauty. Spanning 1,512 sq ft, this bright, airy 3-bed, 2-bath home features a cozy living room fireplace, an attached 2-car garage, and freshly painted interiors. Enjoy peace of mind with a brand-new central A/C system, plus central heat, a swamp cooler, and a newly installed washer and dryer. The massive 14,683 sq ft lot, offering unparalleled privacy, jaw-dropping mountain views, and front-row seats to the Milky Way in this designated International Dark Sky Community. Minutes from Anza-Borrego Desert State Park, hiking, golf, and town. Come claim your piece of California paradise!
Features & Amenities
Property Details
Mortgage Calculator
Current Rates
Comparative Market Analysis
Affordable Tier · 0 active · 5 closed
Borrego Springs · Single Family Residence
Listed 5.3% above the median closed sale of $375,000. Price per sqft ($261) is a 19% premium to closed comps ($220).
Price Position
Positioned above the market — commands a premium.
Closed Properties (5)
Closed Comparables
| Address | City | Year | Date | BD | BTH | SqFt | LotSz | LP | SP | SP/SqFt | SP/LP | DIM | Score |
|---|---|---|---|---|---|---|---|---|---|---|---|---|---|
| 1826 Lazy S Drive | Borrego Springs | 2006 | 07/31/2026 | 3 | 2 | 1,366 | 13,504 | $375,000 | $375,000 | $275 | 1.00 | 51 | 89 |
| 376 Wranglers Drive | Borrego Springs | 1980 | 06/29/2026 | 3 | 2 | 1,851 | 21,344 | $375,000 | $350,000 | $189 | 0.93 | 152 | 82 |
| 1549 Sandstone Circle | Borrego Springs | 1994 | 05/12/2026 | 3 | 3 | 2,305 | 15,246 | $489,000 | $454,000 | $197 | 0.93 | 86 | 69 |
| 538 Quail Run Drive | Borrego Springs | 2002 | 05/01/2026 | 2 | 3 | 2,187 | 8,276 | $459,000 | $443,000 | $203 | 0.96 | 147 | 66 |
| 2858 Back Nine Drive | Borrego Springs | 2000 | 11/14/2025 | 2 | 2 | 1,574 | 7,164 | $375,000 | $370,000 | $235 | 0.99 | 113 | 63 |
| Total: 5 · Average | 2.6 | 2.4 | 1,856.6 | 13,106.8 | $398,400 | $398,400 | $219.8 | — | 109.8 | ||||
| Median | 1,851 | $375,000 | $375,000 | ||||||||||
Market Analysis
List vs Sale $/SqFt
Sale Price Trend
Days on Market
Sale vs List Price
This analysis was generated automatically from MLS data. For an in-depth, human-reviewed valuation, contact Joseph Sardella at josephsardella@gmail.com.