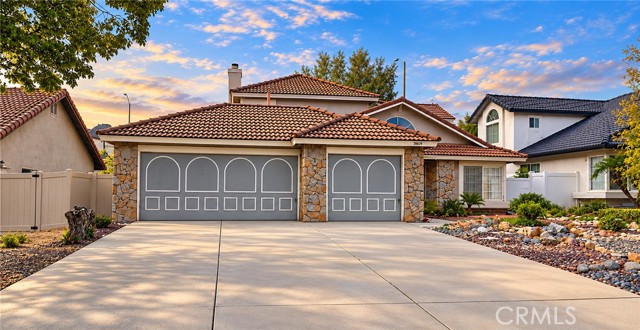
20579 Bloomfield, Riverside, CA 92508
20579 Bloomfield, Riverside, CA 92508
Property Description
**Looking for a Great Value with Room to Build Equity? This Is Your Opportunity!** Bring your vision and unlock the potential of this spacious 4-bedroom, 3-bath home in a desirable neighborhood near highly regarded schools. Featuring a flexible floor plan with a downstairs bedroom and full bath, separate living and family rooms, and a spacious primary suite. Additional highlights include a 3-car garage and low-maintenance front landscaping. This home needs some TLC, but offers plenty of space, potential, and an opportunity to make it your own. **A little work could go a long way—don't miss this opportunity!**
Features & Amenities
Property Details
Mortgage Calculator
Current Rates
Comparative Market Analysis
Residential Tier · 5 active · 5 closed
Riverside · Single Family Residence
Listed 6.8% below the median closed sale of $697,150.
Price Position
Priced below the market — value advantage over the field.
Active Properties (5)
Active Comparables
| Address | City | Year | BD | BTH | SqFt | LotSz | LP/SqFt | LP | DIM | Score |
|---|---|---|---|---|---|---|---|---|---|---|
| 8732 Sandhill | Riverside | 1989 | 4 | 3 | 1,840 | 6,534 | $380 | $699,900 | 4 | 92 |
| 8932 Mesa Oak | Riverside | 1991 | 3 | 3 | 2,447 | 6,969 | $280 | $686,000 | 47 | 87 |
| 20311 Edmund Road | Riverside | 1991 | 3 | 3 | 1,970 | 6,970 | $363 | $715,000 | 61 | 85 |
| 8751 Rosebay Court | Riverside | 1991 | 3 | 2 | 1,678 | 7,841 | $402 | $675,000 | 41 | 75 |
| 8615 Barton | Riverside | 1991 | 3 | 2 | 1,255 | 6,098 | $506 | $635,000 | 23 | 71 |
| Total: 5 · Average | 3.2 | 2.6 | 1,838 | 6,882.4 | $386.2 | $682,180 | 35.2 | |||
| Median | 1,840 | $686,000 | ||||||||
Closed Properties (5)
Closed Comparables
| Address | City | Year | Date | BD | BTH | SqFt | LotSz | LP | SP | SP/SqFt | SP/LP | DIM | Score |
|---|---|---|---|---|---|---|---|---|---|---|---|---|---|
| 20646 Mesa Oak | Riverside | 1990 | 01/30/2026 | 4 | 3 | 2,155 | 7,405 | $715,000 | $716,000 | $332 | 1.00 | 41 | 93 |
| 20228 June Court | Riverside | 1991 | 03/27/2026 | 4 | 3 | 2,200 | 6,970 | $729,000 | $729,000 | $331 | 1.00 | 43 | 91 |
| 20599 Bloomfield Road | Riverside | 1994 | 12/18/2025 | 4 | 3 | 2,240 | 9,583 | $695,000 | $697,150 | $311 | 1.00 | 45 | 91 |
| 20241 Edmund Road | Riverside | 1990 | 12/17/2025 | 4 | 3 | 2,200 | 7,405 | $715,000 | $690,000 | $314 | 0.96 | 181 | 90 |
| 20611 Bakal Drive | Riverside | 1992 | 12/31/2025 | 4 | 3 | 2,540 | 6,970 | $695,000 | $690,000 | $272 | 0.99 | 117 | 89 |
| Total: 5 · Average | 4.0 | 3.0 | 2,267 | 7,666.6 | $704,430 | $704,430 | $312 | — | 85.4 | ||||
| Median | 2,200 | $697,150 | $697,150 | ||||||||||
Market Analysis
List vs Sale $/SqFt
Sale Price Trend
Days on Market
Sale vs List Price
This analysis was generated automatically from MLS data. For an in-depth, human-reviewed valuation, contact Joseph Sardella at josephsardella@gmail.com.