1 / 40
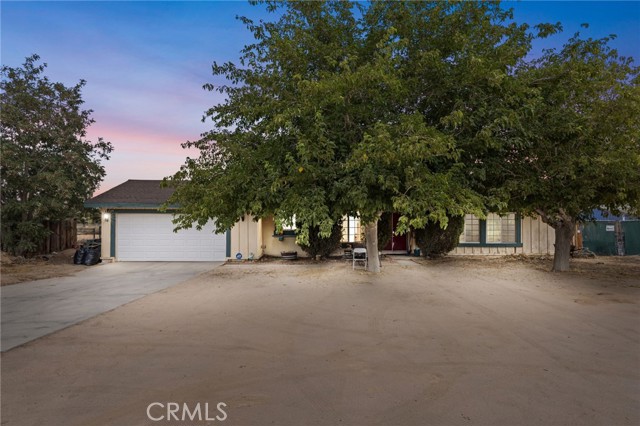
20548 Sitting Bull, Apple Valley, CA 92308
$399K3bd · 2ba · 2,000 sqft
Lot 21,255 sqft•Single Family Residence•Active•75d on market•MLS# IG-26176477
20548 Sitting Bull, Apple Valley, CA 92308
MLS# IG-26176477•Residential•Single Family Residence
Active75 days on market
$399,000
3
Beds
2
Baths
2,000
Sq Ft
21,255
Lot Sq Ft
1978
Year Built
Desert
View
Property Description
Welcome Home! This 3 bedroom, 2 bath home has over 2,000 square feet of living space, large covered patio, 2 car garage and sits on a half acre lot in central Apple Valley near excellent schools, shopping and more.
Features & Amenities
FeeBuilt 1978
Property Details
Land Type
Fee
Year Built
1978
Property Type
Residential
Property Subtype
Single Family Residence
Parking Spaces
2
Garage Spaces
2
Heating
Central, Fireplace(s)
Cooling
Central Air
View
Desert
Flooring
Vinyl, Carpet, Laminate, Tile
Roof
Composition
City
Apple Valley
Zip Code
92308
County
San Bernardino
Mortgage Calculator
Current Rates
$
$
%
Monthly Payment
$2,017.56
Principal & Interest
Loan Amount
$319,200
Total Interest
$407,122
Total Payment Over 30 Years
$726,322
This calculator provides estimates only. Actual mortgage payments may include taxes, insurance, HOA fees, and PMI. Contact a lender for accurate quotes.
Comparative Market Analysis
Affordable Tier · 5 active · 5 closed
20548 Sitting Bull, Apple Valley, CA 92308
Apple Valley · Single Family Residence
$399K
Affordable TierBeds
3
Baths
2
Sqft
2,000
Lot
21,255 sqft
Year
1978
$/Sqft
$200
Pool: No✓
Spa: No✓
View: desert✓
Garage: 2-car✓
Listed 6.1% below the median closed sale of $425,000.
Price Position
Priced below the market — value advantage over the field.
Price advantage
Subject listed at $399K· $200/sqft
Total list price
Closed comps
vs closed median $425K
−$26K (−6.1%)
Active comps
vs active median $400K
−$900 (−0.2%)
Price per sqft
Closed compsinsufficient comp data
Active comps
vs active avg $/sqft $262
−$62 (−23.7%)
Active Properties (5)
Active Comparables
| Address | City | Year | BD | BTH | SqFt | LotSz | LP/SqFt | LP | DIM | Score |
|---|---|---|---|---|---|---|---|---|---|---|
| 12790 Patoka Court | Apple Valley | 1983 | 3 | 3 | 1,756 | 26,000 | $256 | $450,000 | 219 | 81 |
| 20565 Winona Rd | Apple Valley | 1967 | 3 | 2 | 1,494 | 22,550 | $258 | $385,000 | 88 | 81 |
| 20800 Sholic | Apple Valley | 1954 | 4 | 2 | 1,465 | 23,000 | $263 | $385,000 | 47 | 78 |
| 20555 Sitting Bull | Apple Valley | 1985 | 2 | 2 | 1,183 | 23,780 | $338 | $399,900 | 67 | 77 |
| 12579 Kewanna | Apple Valley | 1956 | 5 | 2 | 2,300 | 19,500 | $195 | $449,000 | 45 | 75 |
| Total: 5 · Average | 3.4 | 2.2 | 1,639.6 | 22,966 | $262 | $413,780 | 93.2 | |||
| Median | 1,494 | $399,900 | ||||||||
Closed Properties (5)
Closed Comparables
| Address | City | Year | Date | BD | BTH | SqFt | LotSz | LP | SP | SP/SqFt | SP/LP | DIM | Score |
|---|---|---|---|---|---|---|---|---|---|---|---|---|---|
| 13251 Winona | Apple Valley | 1983 | 08/20/2026 | 3 | 2 | 1,846 | 23,530 | $445,000 | $445,000 | $241 | 1.00 | 45 | 89 |
| 20357 Ituma | Apple Valley | 1980 | 07/06/2026 | 4 | 2 | 2,064 | 27,300 | $429,999 | $433,000 | $210 | 1.01 | 230 | 87 |
| 20239 Osseo | Apple Valley | 1979 | 10/22/2026 | 3 | 3 | 1,899 | 28,275 | $399,900 | $365,000 | $192 | 0.91 | 43 | 85 |
| 13253 Pocono | Apple Valley | 1988 | 10/09/2026 | 3 | 2 | 2,307 | 23,530 | $439,000 | $425,000 | $184 | 0.97 | 92 | 83 |
| 12994 Iroquois Road | Apple Valley | 1987 | 11/19/2025 | 3 | 2 | 2,140 | 26,100 | $387,000 | $395,000 | $185 | 1.02 | 94 | 81 |
| Total: 5 · Average | 3.2 | 2.2 | 2,051.2 | 25,747 | $412,600 | $412,600 | $202.4 | — | 100.8 | ||||
| Median | 2,064 | $425,000 | $425,000 | ||||||||||
Market Analysis
List vs Sale $/SqFt
Sale Price Trend
Days on Market
Sale vs List Price
AI-generated CMA
This analysis was generated automatically from MLS data. For an in-depth, human-reviewed valuation, contact Joseph Sardella at josephsardella@gmail.com.