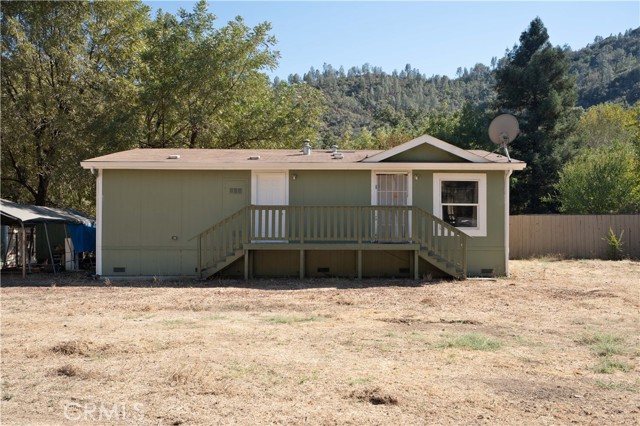
2043 New Long Valley Road, Clearlake Oaks, CA 95423
2043 New Long Valley Road, Clearlake Oaks, CA 95423
Property Description
Enjoy space and privacy at this 3 bedroom 2 bath home situated on 3 mostly level acres in the quiet community of Spring Valley. The spacious interior offers comfortable living, while the garage provides room for parking and storage. A creek runs through the property, adding to its natural setting. With ample outdoor space for gardening, recreation, or simply relaxing, this property offers an inviting opportunity to enjoy country living.
Features & Amenities
Property Details
Mortgage Calculator
Current Rates
Comparative Market Analysis
Affordable Tier · 3 active · 3 closed
Clearlake Oaks · Manufactured On Land
Listed 13.6% above the median closed sale of $330,000. Price per sqft ($347) is a 61% premium to closed comps ($215).
Price Position
Positioned above the market — commands a premium.
Active Properties (3)
Active Comparables
| Address | City | Year | BD | BTH | SqFt | LotSz | LP/SqFt | LP | DIM | Score |
|---|---|---|---|---|---|---|---|---|---|---|
| 16347 Pueblo Trail | Clearlake Oaks | 2023 | 2 | 2 | 1,040 | 123,275 | $384 | $399,000 | 283 | 79 |
| 17706 Holly Way | Clearlake Oaks | 2002 | 2 | 2 | 1,450 | 0 | $269 | $390,000 | 173 | 70 |
| 3725 Spring Valley | Clearlake Oaks | 1977 | 3 | 3 | 3,140 | 57,064 | $127 | $399,000 | 94 | 48 |
| Total: 3 · Average | 2.3 | 2.3 | 1,876.667 | 90,169.5 | $260 | $396,000 | 183.33333333333334 | |||
| Median | 1,450 | $399,000 | ||||||||
Closed Properties (3)
Closed Comparables
| Address | City | Year | Date | BD | BTH | SqFt | LotSz | LP | SP | SP/SqFt | SP/LP | DIM | Score |
|---|---|---|---|---|---|---|---|---|---|---|---|---|---|
| 2940 Blackfeet Trail | Clearlake Oaks | 2004 | 08/28/2026 | 3 | 2 | 1,500 | 57,064 | $345,000 | $330,000 | $220 | 0.96 | 169 | 78 |
| 2984 Indian Hill Road | Clearlake Oaks | 1994 | 10/28/2026 | 3 | 2 | 1,508 | 34,412 | $324,900 | $320,000 | $212 | 0.98 | 33 | 73 |
| 2342 River View | Clearlake Oaks | 2002 | 04/03/2026 | 3 | 2 | 1,700 | 50,094 | $364,000 | $364,000 | $214 | 1.00 | 76 | 63 |
| Total: 3 · Average | 3.0 | 2.0 | 1,569.333 | 47,190 | $338,000 | $338,000 | $215.333 | — | 92.66666666666667 | ||||
| Median | 1,508 | $330,000 | $330,000 | ||||||||||
Market Analysis
List vs Sale $/SqFt
Sale Price Trend
Days on Market
Sale vs List Price
This analysis was generated automatically from MLS data. For an in-depth, human-reviewed valuation, contact Joseph Sardella at josephsardella@gmail.com.