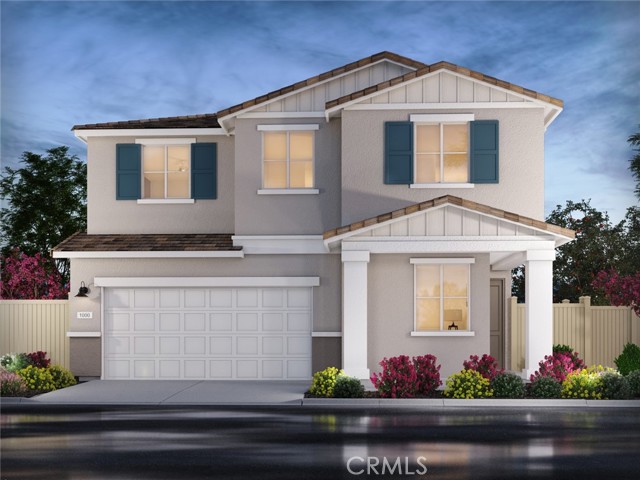
2037 Grapefruit Street, Redlands, CA 92374
2037 Grapefruit Street, Redlands, CA 92374
Property Description
Brand new, energy-efficient home available by Jul 2026! Welcome visitors to stay in the first-floor guest bedroom while hosting in the open great room and gourmet kitchen. The backyard is a perfect backdrop for al-fresco dining and the large secondary bedrooms plus loft provide the perfect retreat. Alder at Live Oak is now selling with designer-decorated model homes in Redlands, CA offering a collection of two-story floorplans. These single-family homes boast private, entry-level suites, spacious lofts, walk-in laundry rooms and large backyards. Each energy-efficient home also comes standard with features that go beyond helping you save on utility bills—they allow your whole family to live better and breathe easier too. Each of our homes is built with innovative, energy-efficient features designed to help you enjoy more savings, better health, real comfort and peace of mind.
Features & Amenities
Property Details
Mortgage Calculator
Current Rates
Comparative Market Analysis
Residential Tier · 5 active · 5 closed
Redlands · Single Family Residence
Listed in line with the median closed sale of $722,700.
Price Position
Aligned with the market — fair pricing for the comps.
Active Properties (5)
Active Comparables
| Address | City | Year | BD | BTH | SqFt | LotSz | LP/SqFt | LP | DIM | Score |
|---|---|---|---|---|---|---|---|---|---|---|
| 2038 Grapefruit Street | Redlands | 2026 | 4 | 3 | 2,168 | 3,500 | $325 | $704,000 | 74 | 94 |
| 831 Dahlia | Redlands | 2024 | 4 | 3 | 2,449 | 4,244 | $306 | $750,000 | 4 | 91 |
| 1939 Limetta Lane | Redlands | 2026 | 4 | 3 | 2,125 | 3,500 | $310 | $659,000 | 69 | 83 |
| 1955 Limetta Lane | Redlands | 2026 | 4 | 3 | 2,125 | 3,500 | $319 | $678,500 | 72 | 83 |
| 1951 Limetta Lane | Redlands | 2026 | 3 | 3 | 1,815 | 3,500 | $347 | $629,000 | 72 | 78 |
| Total: 5 · Average | 3.8 | 3.0 | 2,136.4 | 3,648.8 | $321.4 | $684,100 | 58.2 | |||
| Median | 2,125 | $678,500 | ||||||||
Closed Properties (5)
Closed Comparables
| Address | City | Year | Date | BD | BTH | SqFt | LotSz | LP | SP | SP/SqFt | SP/LP | DIM | Score |
|---|---|---|---|---|---|---|---|---|---|---|---|---|---|
| 2070 Tangelo Lane | Redlands | 2026 | 05/21/2026 | 5 | 3 | 2,418 | 3,500 | $741,900 | $741,900 | $307 | 1.00 | 119 | 98 |
| 2046 Meyer Lane | Redlands | 2025 | 11/12/2025 | 5 | 3 | 2,418 | 3,500 | $695,000 | $694,000 | $287 | 1.00 | 71 | 94 |
| 934 Fuchsia Circle | Redlands | 2026 | 06/17/2026 | 4 | 3 | 2,168 | 3,500 | $722,700 | $722,700 | $333 | 1.00 | 91 | 94 |
| 2037 Tangelo Lane | Redlands | 2025 | 12/29/2025 | 5 | 3 | 2,418 | 3,500 | $733,900 | $733,900 | $304 | 1.00 | 41 | 94 |
| 2070 Meyer Lane | Redlands | 2025 | 12/19/2025 | 5 | 3 | 2,418 | 3,500 | $722,327 | $704,000 | $291 | 0.97 | 42 | 94 |
| Total: 5 · Average | 4.8 | 3.0 | 2,368 | 3,500 | $719,300 | $719,300 | $304.4 | — | 72.8 | ||||
| Median | 2,418 | $722,700 | $722,700 | ||||||||||
Market Analysis
List vs Sale $/SqFt
Sale Price Trend
Days on Market
Sale vs List Price
This analysis was generated automatically from MLS data. For an in-depth, human-reviewed valuation, contact Joseph Sardella at josephsardella@gmail.com.