20331 Bluffside Circle, A211, Huntington Beach, CA 92646
20331 Bluffside Circle, A211, Huntington Beach, CA 92646
Property Description
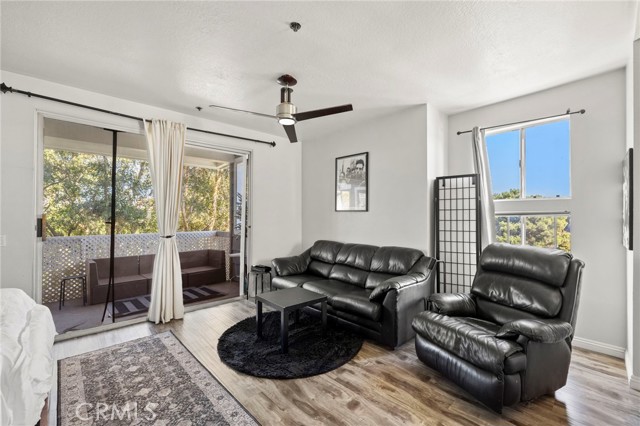
Perfectly positioned corner unit with open sky and tree views. Studio apartment in the 24-hour guard gated community of Seabridge with elevators. Enjoy all lifestyle amenities including multiple pools, spas, tennis courts, ponds, dog park, sauna, fully equipped gym and clubhouse. Prime location only minutes to Downtown HB, the beach, groceries, shopping, restaurants and freeway.
Features & Amenities
Property Details
Mortgage Calculator
Current Rates
Comparative Market Analysis
Affordable Tier · 4 active · 5 closed
Huntington Beach · Condominium
Listed 9.5% below the median closed sale of $475,000. Price per sqft ($860) is a 11% premium to closed comps ($778).
Price Position
Priced below the market — value advantage over the field.
Active Properties (4)
Active Comparables
| Address | City | Year | BD | BTH | SqFt | LotSz | LP/SqFt | LP | DIM | Score |
|---|---|---|---|---|---|---|---|---|---|---|
| 20301 Bluffside | Huntington Beach | 1985 | 0 | 1 | 500 | 176,372 | $920 | $460,000 | 24 | 100 |
| 20251 Cape Coral Ln | Huntington Beach | 1986 | 0 | 1 | 500 | 136,535 | $970 | $485,000 | 141 | 96 |
| 409 Utica | Huntington Beach | 1992 | 1 | 1 | 644 | 75,973 | $745 | $480,000 | 87 | 84 |
| 409 Utica | Huntington Beach | 1993 | 1 | 1 | 766 | 75,973 | $625 | $479,000 | 72 | 78 |
| Total: 4 · Average | 0.5 | 1.0 | 602.5 | 116,213.25 | $815 | $476,000 | 81 | |||
| Median | 644 | $480,000 | ||||||||
Closed Properties (5)
Closed Comparables
| Address | City | Year | Date | BD | BTH | SqFt | LotSz | LP | SP | SP/SqFt | SP/LP | DIM | Score |
|---|---|---|---|---|---|---|---|---|---|---|---|---|---|
| 20341 Bluffside Circle | Huntington Beach | 1984 | 03/30/2026 | 0 | 1 | 500 | 0 | $495,000 | $475,000 | $950 | 0.96 | 40 | 96 |
| 20331 Bluffside Circle | Huntington Beach | 1987 | 11/20/2025 | 0 | 1 | 500 | 176,372 | $480,000 | $480,000 | $960 | 1.00 | 0 | 93 |
| 18292 Parkview Lane | Huntington Beach | 1984 | 10/15/2026 | 1 | 1 | 600 | 0 | $389,500 | $389,500 | $649 | 1.00 | 84 | 75 |
| 18292 Parkview | Huntington Beach | 1984 | 08/03/2026 | 1 | 1 | 593 | 15,842 | $422,500 | $420,000 | $708 | 0.99 | 62 | 74 |
| 8777 Coral Springs Court | Huntington Beach | 1972 | 07/31/2026 | 1 | 1 | 784 | 784 | $499,000 | $490,000 | $625 | 0.98 | 58 | 73 |
| Total: 5 · Average | 0.6 | 1.0 | 595.4 | 64,332.667 | $450,900 | $450,900 | $778.4 | — | 48.8 | ||||
| Median | 593 | $475,000 | $475,000 | ||||||||||
Market Analysis
List vs Sale $/SqFt
Sale Price Trend
Days on Market
Sale vs List Price
This analysis was generated automatically from MLS data. For an in-depth, human-reviewed valuation, contact Joseph Sardella at josephsardella@gmail.com.