20251 Cape Coral Ln, 202, Huntington Beach, CA 92646
20251 Cape Coral Ln, 202, Huntington Beach, CA 92646
Property Description
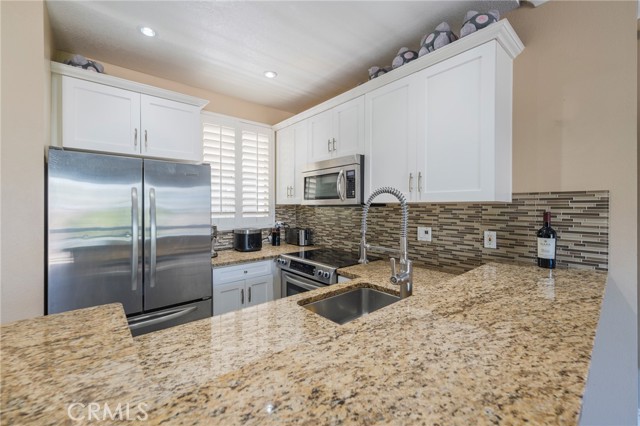
Vibes ! Life is amazing down the street from the Beach ! Located in Seabridge ! This Beautiful End Unit has 3 sides of Natural Sunlight shining in, is located is an interior section of the Villas - Upgraded and Pristine - Newer Cabinets , Upgraded Granite - Stainless Steel Appliances - Brand new Carpet and Flooring thru-out ! Lots of Closet space that can easily be turned into a large walk-in Closet - Inside Washer/Dryer - Spacious Bedroom area (currently being used as a Studio) - Large Balcony looks out to the trees and Lush Greenery - Seabridge is a Guard Gated Community with All the Ammenities you could ever ask for - Pools, Jacuzzis, Tennis Courts, Large Sauna, and a Fantastic Gym ! Just down the street from the Beach, Huntington Beach Pier, Main Street, Pacific City, Plus Top Flight Restaurants and Shopping !!!
Features & Amenities
Property Details
Mortgage Calculator
Current Rates
Comparative Market Analysis
Affordable Tier · 5 active · 5 closed
Huntington Beach · Condominium
Listed 4.7% below the median closed sale of $509,000. Price per sqft ($970) is a 17% premium to closed comps ($832).
Price Position
Aligned with the market — fair pricing for the comps.
Active Properties (5)
Active Comparables
| Address | City | Year | BD | BTH | SqFt | LotSz | LP/SqFt | LP | DIM | Score |
|---|---|---|---|---|---|---|---|---|---|---|
| 20331 Bluffside Circle | Huntington Beach | 1985 | 0 | 1 | 500 | 0 | $860 | $430,000 | 4 | 99 |
| 20301 Bluffside | Huntington Beach | 1985 | 0 | 1 | 500 | 176,372 | $920 | $460,000 | 24 | 97 |
| 20331 Bluffside | Huntington Beach | 1983 | 0 | 1 | 600 | 176,372 | $892 | $535,000 | 38 | 89 |
| 409 Utica | Huntington Beach | 1992 | 1 | 1 | 644 | 75,973 | $745 | $480,000 | 87 | 83 |
| 409 Utica | Huntington Beach | 1993 | 1 | 1 | 766 | 75,973 | $625 | $479,000 | 72 | 77 |
| Total: 5 · Average | 0.4 | 1.0 | 602 | 126,172.5 | $808.4 | $476,800 | 45 | |||
| Median | 600 | $479,000 | ||||||||
Closed Properties (5)
Closed Comparables
| Address | City | Year | Date | BD | BTH | SqFt | LotSz | LP | SP | SP/SqFt | SP/LP | DIM | Score |
|---|---|---|---|---|---|---|---|---|---|---|---|---|---|
| 20341 Bluffside Circle | Huntington Beach | 1984 | 03/30/2026 | 0 | 1 | 500 | 0 | $495,000 | $475,000 | $950 | 0.96 | 40 | 95 |
| 20331 Bluffside Circle | Huntington Beach | 1987 | 11/20/2025 | 0 | 1 | 500 | 176,372 | $480,000 | $480,000 | $960 | 1.00 | 0 | 92 |
| 20341 Bluffside | Huntington Beach | 1988 | 02/27/2026 | 0 | 1 | 600 | 176,372 | $519,000 | $509,000 | $848 | 0.98 | 73 | 86 |
| 20191 Cape Coral | Huntington Beach | 1983 | 12/30/2025 | 1 | 1 | 767 | 136,535 | $530,000 | $530,000 | $691 | 1.00 | 26 | 78 |
| 20371 Bluffside Circle | Huntington Beach | 1987 | 01/02/2026 | 1 | 1 | 760 | 176,372 | $539,000 | $539,000 | $709 | 1.00 | 128 | 77 |
| Total: 5 · Average | 0.4 | 1.0 | 625.4 | 166,412.75 | $506,600 | $506,600 | $831.6 | — | 53.4 | ||||
| Median | 600 | $509,000 | $509,000 | ||||||||||
Market Analysis
List vs Sale $/SqFt
Sale Price Trend
Days on Market
Sale vs List Price
This analysis was generated automatically from MLS data. For an in-depth, human-reviewed valuation, contact Joseph Sardella at josephsardella@gmail.com.