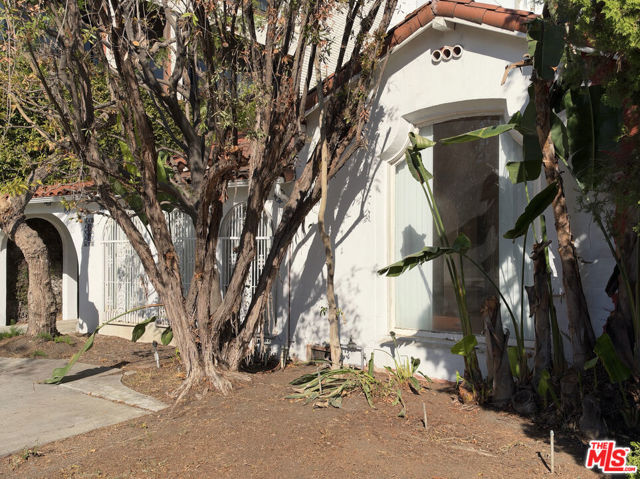
202 South Le Doux Road, Beverly Hills, CA 90211
202 South Le Doux Road, Beverly Hills, CA 90211
Property Description
Prime Beverly Hills opportunity in an exceptional location. Set on a desirable street surrounded by distinguished residences, 202 S Le Doux presents a rare chance to reimagine or redevelop the property and create a residence tailored to the site. Offered as-is and ideal for developers, builders, or end users seeking a premier Beverly Hills address.
Features & Amenities
Property Details
Mortgage Calculator
Current Rates
Comparative Market Analysis
Luxury Tier · 5 active · 5 closed
Beverly Hills · Single Family Residence
Listed 5.7% above the median closed sale of $2,365,000. Closed comps sold at 106% of list — strong seller's market. Luxury tier — fewer comparable sales widen the confidence range.
Price Position
Positioned above the market — commands a premium.
Active Properties (5)
Active Comparables
| Address | City | Year | BD | BTH | SqFt | LotSz | LP/SqFt | LP | DIM | Score |
|---|---|---|---|---|---|---|---|---|---|---|
| 1042 Alvira Street | Los Angeles | 1934 | 3 | 4 | 2,299 | 7,059 | $1,042 | $2.40M | 37 | 86 |
| 133 Kilkea Drive | Los Angeles | 1926 | 4 | 3 | 2,500 | 6,551 | $1,140 | $2.85M | 38 | 86 |
| 478 Sherbourne Drive | Los Angeles | 1937 | 3 | 2 | 1,856 | 5,853 | $1,237 | $2.29M | 83 | 84 |
| 353 Huntley Drive | Los Angeles | 1924 | 3 | 3 | 1,821 | 5,447 | $1,290 | $2.35M | 4 | 80 |
| 118 La Peer Drive | Los Angeles | 1926 | 3 | 3 | 1,748 | 6,001 | $1,487 | $2.60M | 146 | 79 |
| Total: 5 · Average | 3.2 | 3.0 | 2,044.8 | 6,182.2 | $1,239.2 | $2.50M | 61.6 | |||
| Median | 1,856 | $2.40M | ||||||||
Closed Properties (5)
Closed Comparables
| Address | City | Year | Date | BD | BTH | SqFt | LotSz | LP | SP | SP/SqFt | SP/LP | DIM | Score |
|---|---|---|---|---|---|---|---|---|---|---|---|---|---|
| 202 Hamel Drive | Beverly Hills | 1923 | 06/17/2026 | 3 | 2 | 2,085 | 6,498 | $2.50M | $2.61M | $1,253 | 1.05 | 35 | 90 |
| 203 Carson | Beverly Hills | 1924 | 06/17/2026 | 3 | 2 | 1,797 | 6,497 | $2.00M | $2.24M | $1,247 | 1.12 | 35 | 88 |
| 208 Carson | Beverly Hills | 1925 | 09/11/2026 | 2 | 2 | 1,891 | 6,748 | $2.15M | $2.32M | $1,227 | 1.08 | 50 | 88 |
| 6667 5th Street | Los Angeles | 1929 | 04/03/2026 | 4 | 3 | 2,918 | 6,002 | $2.40M | $2.37M | $810 | 0.99 | 64 | 85 |
| 227 Stanley Drive | Beverly Hills | 1930 | 08/21/2026 | 6 | 3 | 2,940 | 5,767 | $2.35M | $2.45M | $833 | 1.04 | 45 | 84 |
| Total: 5 · Average | 3.6 | 2.4 | 2,326.2 | 6,302.4 | $2.40M | $2.40M | $1,074 | — | 45.8 | ||||
| Median | 2,085 | $2.37M | $2.37M | ||||||||||
Market Analysis
List vs Sale $/SqFt
Sale Price Trend
Days on Market
Sale vs List Price
This analysis was generated automatically from MLS data. For an in-depth, human-reviewed valuation, contact Joseph Sardella at josephsardella@gmail.com.