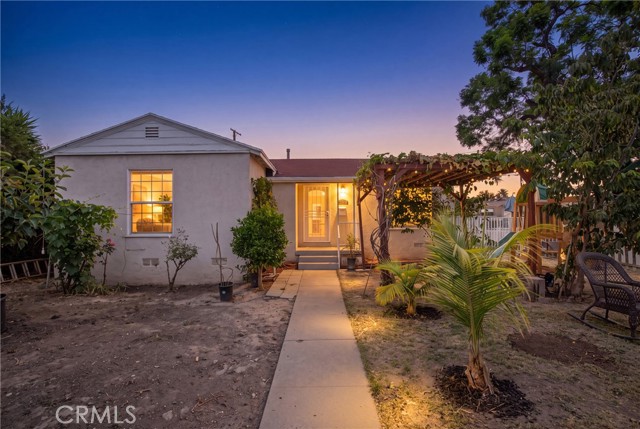
1 / 44
2011 North Grape, Compton, CA 90222
$695K3bd · 1ba · 1,103 sqft
Lot 5,350 sqft•Single Family Residence•Active•112d on market•MLS# MB-26152692
2011 North Grape, Compton, CA 90222
MLS# MB-26152692•Residential•Single Family Residence
Active112 days on market
$695,000
3
Beds
1
Baths
1,103
Sq Ft
5,350
Lot Sq Ft
1947
Year Built
None
View
Property Description
Beautiful corner lot home in a great area of Compton. This home features 3 spacious bedrooms with 1 bathroom. This home features a detached 2 car garage and a large backyard for relaxing or entertaining. Conveniently located nearby the 91 FWY and 710 FWY making it easily accessible for commuters as well.
Features & Amenities
FeeBuilt 1947
Property Details
Land Type
Fee
Year Built
1947
Property Type
Residential
Property Subtype
Single Family Residence
Parking Spaces
2
Garage Spaces
2
Cooling
None
View
None
City
Compton
Zip Code
90222
County
Los Angeles
Mortgage Calculator
Current Rates
$
$
%
Monthly Payment
$3,514.30
Principal & Interest
Loan Amount
$556,000
Total Interest
$709,147
Total Payment Over 30 Years
$1,265,147
This calculator provides estimates only. Actual mortgage payments may include taxes, insurance, HOA fees, and PMI. Contact a lender for accurate quotes.
Comparative Market Analysis
Affordable Tier · 5 active · 5 closed
2011 North Grape, Compton, CA 90222
Compton · Single Family Residence
$695K
Affordable TierBeds
3
Baths
1
Sqft
1,103
Lot
5,350 sqft
Year
1947
$/Sqft
$630
Pool: No✓
View: None✓
Garage: 2-car✓
Listed 7.8% above the median closed sale of $644,900. Closed comps sold at 103% of list — strong seller's market.
Price Position
Positioned above the market — commands a premium.
Premium
Subject listed at $695K· $630/sqft
Total list price
Closed comps
vs closed median $645K
+$50K (+7.8%)
Active comps
vs active median $620K
+$75K (+12.1%)
Price per sqft
Closed compsinsufficient comp data
Active comps
vs active avg $/sqft $560
+$70 (+12.4%)
Active Properties (5)
Active Comparables
| Address | City | Year | BD | BTH | SqFt | LotSz | LP/SqFt | LP | DIM | Score |
|---|---|---|---|---|---|---|---|---|---|---|
| 1008 Stockwell | Compton | 1949 | 3 | 1 | 1,048 | 7,649 | $592 | $620,000 | 15 | 93 |
| 815 134th | Compton | 1953 | 3 | 2 | 1,199 | 5,799 | $496 | $595,000 | 33 | 91 |
| 2055 Nord | Compton | 1964 | 3 | 2 | 1,298 | 4,942 | $531 | $689,000 | 29 | 86 |
| 1001 133rd | Compton | 1950 | 3 | 2 | 1,345 | 5,833 | $461 | $620,000 | 79 | 85 |
| 2202 Stockwell | Compton | 1953 | 3 | 1 | 893 | 2,215 | $722 | $645,000 | 15 | 85 |
| Total: 5 · Average | 3.0 | 1.6 | 1,156.6 | 5,287.6 | $560.4 | $633,800 | 34.2 | |||
| Median | 1,199 | $620,000 | ||||||||
Closed Properties (5)
Closed Comparables
| Address | City | Year | Date | BD | BTH | SqFt | LotSz | LP | SP | SP/SqFt | SP/LP | DIM | Score |
|---|---|---|---|---|---|---|---|---|---|---|---|---|---|
| 1903 Grape Avenue | Compton | 1947 | 08/18/2026 | 2 | 1 | 1,042 | 5,400 | $700,000 | $680,000 | $653 | 0.97 | 71 | 92 |
| 910 138th | Compton | 1954 | 04/24/2026 | 3 | 1 | 1,056 | 6,305 | $560,000 | $610,000 | $578 | 1.09 | 52 | 90 |
| 901 134th Place | Compton | 1950 | 10/21/2026 | 3 | 2 | 1,332 | 5,802 | $624,900 | $644,900 | $484 | 1.03 | 54 | 89 |
| 1112 134th Street | Compton | 1940 | 07/13/2026 | 3 | 2 | 908 | 5,801 | $649,999 | $682,500 | $752 | 1.05 | 77 | 86 |
| 1242 134th Street | Compton | 1949 | 12/18/2025 | 3 | 1 | 966 | 5,187 | $609,000 | $609,000 | $630 | 1.00 | 173 | 86 |
| Total: 5 · Average | 2.8 | 1.4 | 1,060.8 | 5,699 | $645,280 | $645,280 | $619.4 | — | 85.4 | ||||
| Median | 1,042 | $644,900 | $644,900 | ||||||||||
Market Analysis
List vs Sale $/SqFt
Sale Price Trend
Days on Market
Sale vs List Price
AI-generated CMA
This analysis was generated automatically from MLS data. For an in-depth, human-reviewed valuation, contact Joseph Sardella at josephsardella@gmail.com.