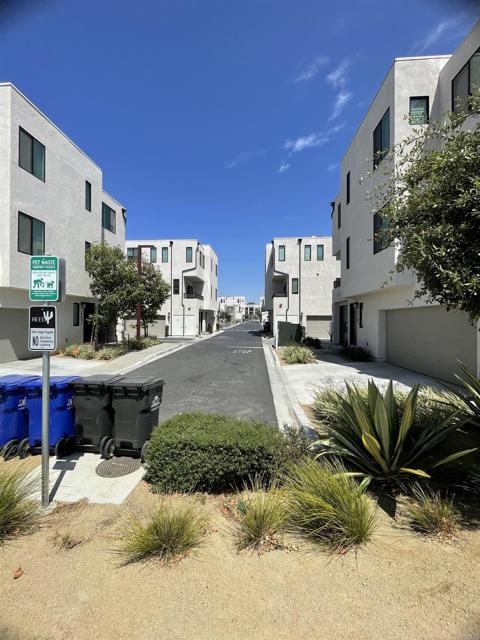
2002 Vela Ln, San Diego, CA 92154
2002 Vela Ln, San Diego, CA 92154
Property Description
Welcome to 2002 Vela Ln San Diego - It is a 2023 build great started home feature a 2 bedroom and 2 and a half bath. There is a bonus room can be use for an office or play room. The two car garage is side by side. The tri-level offers the entry and garage at the fist level, second level is an open space with the kitchen/LVR combo leading to a balcony. The third floor has the two bedroom and two bath with washer and dryer on a closet. It is easy access to freeway, boarder, and much more...
Features & Amenities
Property Details
Mortgage Calculator
Current Rates
Comparative Market Analysis
Affordable Tier · 5 active · 5 closed
San Diego · Condominium
Listed 7.1% below the median closed sale of $630,000. Price per sqft ($501) is a 17% premium to closed comps ($427). Closed comps sold at 101% of list — strong seller's market.
Price Position
Priced below the market — value advantage over the field.
Active Properties (5)
Active Comparables
| Address | City | Year | BD | BTH | SqFt | LotSz | LP/SqFt | LP | DIM | Score |
|---|---|---|---|---|---|---|---|---|---|---|
| 2041 Vela Lane | San Diego | 2024 | 3 | 3 | 1,385 | 0 | $432 | $599,000 | 62 | 94 |
| 2166 Reed Drive | San Diego | 2024 | 3 | 3 | 1,592 | 0 | $408 | $649,999 | 72 | 89 |
| 2416 Cascalote Loop | San Diego | 2023 | 3 | 3 | 1,592 | 0 | $421 | $670,000 | 88 | 89 |
| 5491 Seacliff | San Diego | 2022 | 2 | 3 | 1,309 | 407,844 | $443 | $579,999 | 118 | 80 |
| 1716 San Eugenio | San Diego | 2015 | 3 | 3 | 1,686 | 250,906 | $394 | $665,000 | 13 | 74 |
| Total: 5 · Average | 2.8 | 3.0 | 1,512.8 | 329,375 | $419.6 | $632,799.6 | 70.6 | |||
| Median | 1,592 | $649,999 | ||||||||
Closed Properties (5)
Closed Comparables
| Address | City | Year | Date | BD | BTH | SqFt | LotSz | LP | SP | SP/SqFt | SP/LP | DIM | Score |
|---|---|---|---|---|---|---|---|---|---|---|---|---|---|
| 2325 Acara Circle | San Diego | 2024 | 08/25/2026 | 3 | 3 | 1,592 | 6 | $640,000 | $640,000 | $402 | 1.00 | 62 | 86 |
| 5419 San Roberto | San Diego | 2016 | 10/30/2026 | 3 | 3 | 1,334 | 124,146 | $630,000 | $630,000 | $472 | 1.00 | 141 | 82 |
| 5494 Shorefront Drive | San Diego | 2022 | 08/31/2026 | 2 | 3 | 1,309 | 0 | $569,000 | $569,000 | $435 | 1.00 | 79 | 81 |
| 5471 Seacliff Pl | San Diego | 2022 | 08/04/2026 | 2 | 3 | 1,309 | 0 | $565,000 | $580,000 | $443 | 1.03 | 47 | 80 |
| 5474 Shorefront Drive | San Diego | 2022 | 10/26/2026 | 3 | 3 | 1,703 | 0 | $645,900 | $656,000 | $385 | 1.02 | 191 | 76 |
| Total: 5 · Average | 2.6 | 3.0 | 1,449.4 | 62,076 | $615,000 | $615,000 | $427.4 | — | 104 | ||||
| Median | 1,334 | $630,000 | $630,000 | ||||||||||
Market Analysis
List vs Sale $/SqFt
Sale Price Trend
Days on Market
Sale vs List Price
This analysis was generated automatically from MLS data. For an in-depth, human-reviewed valuation, contact Joseph Sardella at josephsardella@gmail.com.