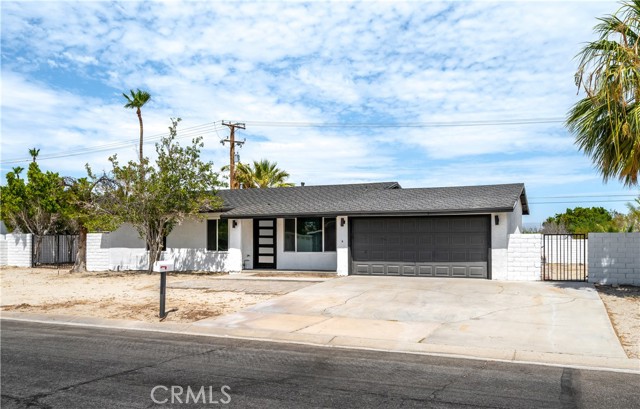
1978 North Whitewater Road, Palm Springs, CA 92262
1978 North Whitewater Road, Palm Springs, CA 92262
Property Description
NO HOA! Welcome to your turnkey Palm Springs desert oasis in desirable Desert Park Estates. Completely remodeled and being offered fully designer-furnished, this 4-bedroom, 2-bath residence combines effortless indoor-outdoor entertaining with classic desert living. The bright, open layout features contemporary flooring, recessed lighting, and a modern chef’s kitchen equipped with sleek quartz countertops, custom cabinetry, and stainless steel appliances. Step outside into your private, oversized 10,000+ sq. ft. lot featuring an in-ground pool, elevated spa, expansive sun patio, and sweeping panoramic views of the San Jacinto Mountains. An exceptional footprint offering 4 full bedrooms—ideal for a primary residence, private desert getaway, or turnkey corporate rental retreat. Located minutes from Downtown Palm Springs dining, shopping, golf, and the airport.
Features & Amenities
Property Details
Mortgage Calculator
Current Rates
Comparative Market Analysis
Affordable Tier · 0 active · 3 closed
Palm Springs · Single Family Residence
Listed 9.1% above the median closed sale of $550,000. Price per sqft ($455) is a 48% premium to closed comps ($307). Closed comps sold at 101% of list — strong seller's market. Comparable homes are moving quickly (avg 23 days on market).
Price Position
Positioned above the market — commands a premium.
Closed Properties (3)
Closed Comparables
| Address | City | Year | Date | BD | BTH | SqFt | LotSz | LP | SP | SP/SqFt | SP/LP | DIM | Score |
|---|---|---|---|---|---|---|---|---|---|---|---|---|---|
| 13422 Cholla | Whitewater | 2025 | 03/03/2026 | 4 | 2 | 1,670 | 10,890 | $550,000 | $550,000 | $329 | 1.00 | 22 | 72 |
| 13442 Cholla | Whitewater | 2025 | 02/10/2026 | 4 | 2 | 1,670 | 10,890 | $550,000 | $550,000 | $329 | 1.00 | 21 | 71 |
| 12628 Excelsior | Whitewater | 2006 | 08/31/2026 | 4 | 2 | 1,944 | 11,326 | $495,000 | $510,000 | $262 | 1.03 | 25 | 59 |
| Total: 3 · Average | 4.0 | 2.0 | 1,761.333 | 11,035.333 | $536,666.667 | $536,666.667 | $306.667 | — | 22.666666666666668 | ||||
| Median | 1,670 | $550,000 | $550,000 | ||||||||||
Market Analysis
List vs Sale $/SqFt
Sale Price Trend
Days on Market
Sale vs List Price
This analysis was generated automatically from MLS data. For an in-depth, human-reviewed valuation, contact Joseph Sardella at josephsardella@gmail.com.