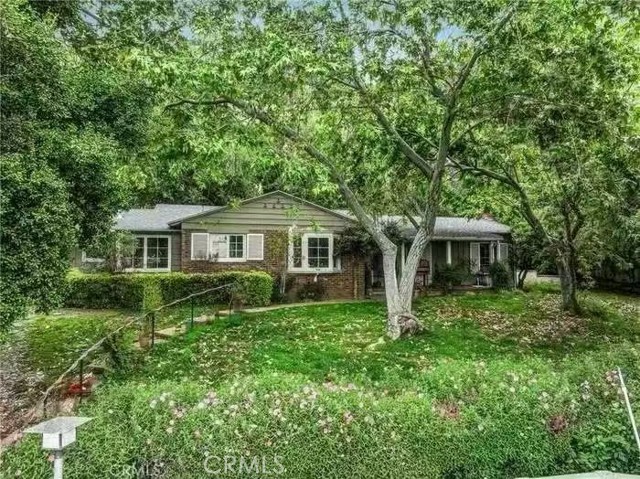
1835 Royal Oaks, Bradbury, CA 91008
1835 Royal Oaks, Bradbury, CA 91008
Property Description
2.46 acres of mostly flat land in the prestigious city of Bradbury. Buyer has the great opportunity to build theri dream home, or for development by subdividing this lot. This home features a large family room, formal dining room, breakfast area, 3 bedrooms, 2 bathrooms, a non-conforming guest house and horse facilities, such as 3 pastures and horse stalls, which is for the Olympic equestrian estate. Some adjacent properties may be available for sale to possible joint lot subdivision. All lot division subject to the City requirements.
Features & Amenities
Property Details
Mortgage Calculator
Current Rates
Comparative Market Analysis
Luxury Tier · 2 active · 5 closed
Bradbury · Single Family Residence
Listed 12.3% above the median closed sale of $2,137,250. Price per sqft ($1,271) is a 86% premium to closed comps ($682). Closed comps sold at 103% of list — strong seller's market. Luxury tier — fewer comparable sales widen the confidence range.
Price Position
Positioned above the market — commands a premium.
Active Properties (2)
Active Comparables
| Address | City | Year | BD | BTH | SqFt | LotSz | LP/SqFt | LP | DIM | Score |
|---|---|---|---|---|---|---|---|---|---|---|
| 175 Mount Olive Drive | Bradbury | 1966 | 5 | 4 | 3,328 | 86,343 | $639 | $2.13M | 333 | 57 |
| 2251 Oak Shade | Bradbury | 1987 | 5 | 5 | 5,158 | 48,252 | $485 | $2.50M | 151 | 35 |
| Total: 2 · Average | 5.0 | 4.5 | 4,243 | 67,297.5 | $562 | $2.31M | 242 | |||
| Median | 5,158 | $2.50M | ||||||||
Closed Properties (5)
Closed Comparables
| Address | City | Year | Date | BD | BTH | SqFt | LotSz | LP | SP | SP/SqFt | SP/LP | DIM | Score |
|---|---|---|---|---|---|---|---|---|---|---|---|---|---|
| 1462 Lemon Ave | Bradbury | 1954 | 02/03/2026 | 4 | 4 | 2,812 | 49,658 | $2.40M | $2.28M | $811 | 0.95 | 138 | 59 |
| 888 Oakglade | Monrovia | 2026 | 06/16/2026 | 3 | 4 | 2,582 | 16,904 | $2.18M | $2.10M | $813 | 0.96 | 58 | 52 |
| 719 Ridgeside Drive | Monrovia | 1949 | 01/07/2026 | 4 | 4 | 4,775 | 31,826 | $2.10M | $2.10M | $440 | 1.00 | 34 | 44 |
| 250 Primrose Avenue | Monrovia | 1885 | 06/05/2026 | 5 | 3 | 4,681 | 14,707 | $2.20M | $2.55M | $544 | 1.16 | 108 | 41 |
| 464 Myrtle Avenue | Monrovia | 1923 | 02/19/2026 | 4 | 4 | 2,667 | 13,660 | $2.00M | $2.14M | $801 | 1.07 | 34 | 38 |
| Total: 5 · Average | 4.0 | 3.8 | 3,503.4 | 25,351 | $2.23M | $2.23M | $681.8 | — | 74.4 | ||||
| Median | 2,812 | $2.14M | $2.14M | ||||||||||
Market Analysis
List vs Sale $/SqFt
Sale Price Trend
Days on Market
Sale vs List Price
This analysis was generated automatically from MLS data. For an in-depth, human-reviewed valuation, contact Joseph Sardella at josephsardella@gmail.com.