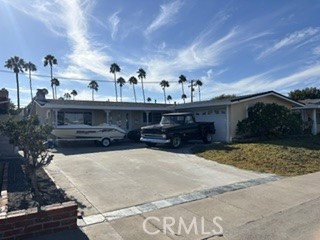
18301 Pammy, Huntington Beach, CA 92648
18301 Pammy, Huntington Beach, CA 92648
Property Description
Welcome to this rare Huntington Beach home with rare LARGE-LOT possible ADU. This home is tucked away within a quiet interior tract, features 3 bedrooms and 2 bathrooms. You will love the curb appeal. This family home has tile flooring, open and airy kitchen features granite counters, rich wood cabinetry, and recessed lightings. Lots of great potentials for first time buyers or investors. Must see1
Features & Amenities
Property Details
Mortgage Calculator
Current Rates
Comparative Market Analysis
Affordable Tier · 5 active · 5 closed
Huntington Beach · Single Family Residence
Listed in line with the median closed sale of $1,272,000. Price per sqft ($1,046) is a 21% premium to closed comps ($864). Closed comps sold at 101% of list — strong seller's market.
Price Position
Aligned with the market — fair pricing for the comps.
Active Properties (5)
Active Comparables
| Address | City | Year | BD | BTH | SqFt | LotSz | LP/SqFt | LP | DIM | Score |
|---|---|---|---|---|---|---|---|---|---|---|
| 8172 Kiner | Huntington Beach | 1956 | 3 | 1 | 1,285 | 7,202 | $1,008 | $1.29M | 25 | 91 |
| 8391 Enfield Circle | Huntington Beach | 1961 | 3 | 2 | 1,227 | 5,978 | $1,080 | $1.32M | 16 | 90 |
| 8181 Holland Drive | Huntington Beach | 1963 | 4 | 2 | 1,279 | 6,000 | $937 | $1.20M | 74 | 85 |
| 8352 Friesland | Huntington Beach | 1963 | 4 | 2 | 1,279 | 6,000 | $1,016 | $1.30M | 11 | 85 |
| 17751 Lewis | Huntington Beach | 1966 | 3 | 2 | 1,244 | 6,000 | $1,085 | $1.35M | 5 | 83 |
| Total: 5 · Average | 3.4 | 1.8 | 1,262.8 | 6,236 | $1,025.2 | $1.29M | 26.2 | |||
| Median | 1,279 | $1.30M | ||||||||
Closed Properties (5)
Closed Comparables
| Address | City | Year | Date | BD | BTH | SqFt | LotSz | LP | SP | SP/SqFt | SP/LP | DIM | Score |
|---|---|---|---|---|---|---|---|---|---|---|---|---|---|
| 7602 Taylor | Huntington Beach | 1960 | 04/29/2026 | 3 | 2 | 1,173 | 7,500 | $1.25M | $1.27M | $1,084 | 1.02 | 21 | 93 |
| 7562 Taylor Drive | Huntington Beach | 1974 | 05/21/2026 | 3 | 2 | 1,424 | 6,142 | $1.30M | $1.33M | $934 | 1.02 | 13 | 87 |
| 8021 Sterling | Huntington Beach | 1956 | 01/30/2026 | 3 | 2 | 1,368 | 7,249 | $1.18M | $1.22M | $888 | 1.03 | 43 | 86 |
| 8191 Taylor Drive | Huntington Beach | 1959 | 05/22/2026 | 4 | 2 | 1,594 | 6,039 | $1.18M | $1.18M | $740 | 1.00 | 58 | 83 |
| 7812 Connie Dr | Huntington Beach | 1979 | 06/05/2026 | 3 | 3 | 1,932 | 4,200 | $1.30M | $1.30M | $673 | 1.00 | 43 | 74 |
| Total: 5 · Average | 3.2 | 2.2 | 1,498.2 | 6,226 | $1.26M | $1.26M | $863.8 | — | 35.6 | ||||
| Median | 1,424 | $1.27M | $1.27M | ||||||||||
Market Analysis
List vs Sale $/SqFt
Sale Price Trend
Days on Market
Sale vs List Price
This analysis was generated automatically from MLS data. For an in-depth, human-reviewed valuation, contact Joseph Sardella at josephsardella@gmail.com.